Change control — Friday 21 August
v2.3.0This went out on Friday 21 August. The page was written the day before, against the copy that would ship on Friday morning, and it is left in that form on purpose: every measurement on it was taken on Thursday, against the live store and against the release side by side, because once a release goes out the “before” is gone and cannot be recovered. The one that mattered most is fixed. Search on the live store was failing — a search for a part number took about seventeen seconds, the page gave up before the answer arrived, and the customer saw an error. The same search now answers in just over a second. That is the first section, ahead of everything else.
One warning on this page has since been answered, and it is the one worth answering. Two sections below say a change went out without passing its check — that the diagram-list fix (search#925) had failed its gate and had never run anywhere. That was true when it was written on Thursday. It failed on the first attempt, was re-run the same afternoon, and passed: gate green at 15:45 UTC Thursday, promoted to all traffic there and then. The release that went out on Friday morning carries that checked version, not the failed one. Read directly from the running service on Saturday 22 August. Nothing else on this page has been re-checked, so read the rest as what was known on Thursday.
Ninety-six changes since the 14 August release: sixty-two on the store website, twenty-one on search, eight on the order and payment services, and five on the internal control room for parts data. Twenty-six are things a customer or Google can notice. The rest are tests, tooling and deletion — they are listed in full at the bottom, one line each.
Every row that could be measured carries a picture of the actual before and after — a page capture where the change is visible, and the real command with its real output where it is not. Where a measurement could not be taken, the row says so in red instead of showing a number.
What is wrong on the live store right now — measured Thursday, not a forecast
Search on the live store is failing, and it has spread beyond search. A shopper searching for something the store has not seen before gets an error page. Measured on Thursday through the day: at 07:35 production refused three cold searches out of three; by 13:00 it was answering, but taking thirty-two seconds, and its own health check — the cheapest question you can ask it — took thirty-nine seconds. The same questions asked of the candidate, against the same database, came back in four to six seconds.
It now reaches plain browsing too. Page two and page ten of the parts catalogue return an error, three times out of three. Earlier in the week those pages were healthy in under a second, and the record we were working from still says they are — that is no longer true, and it means more customers are affected than the ticket describes. Page one and the home page still work.
The cause is that the live search service is running old code. It is thirty-two changes behind what has been built and tested; the repair for exactly this fault is inside that gap. Moving it forward is a switch, not a rebuild — but it takes everything in the gap with it, which is why it belongs on this list rather than being done quietly.
This also blocks the store's own release. The build that produces the website asks the live search service for its brand list; that service refuses, and the build stops. So the same fault is why the storefront half of this release cannot be assembled until search moves first.
What the call has to decide — found on Thursday, ahead of the register
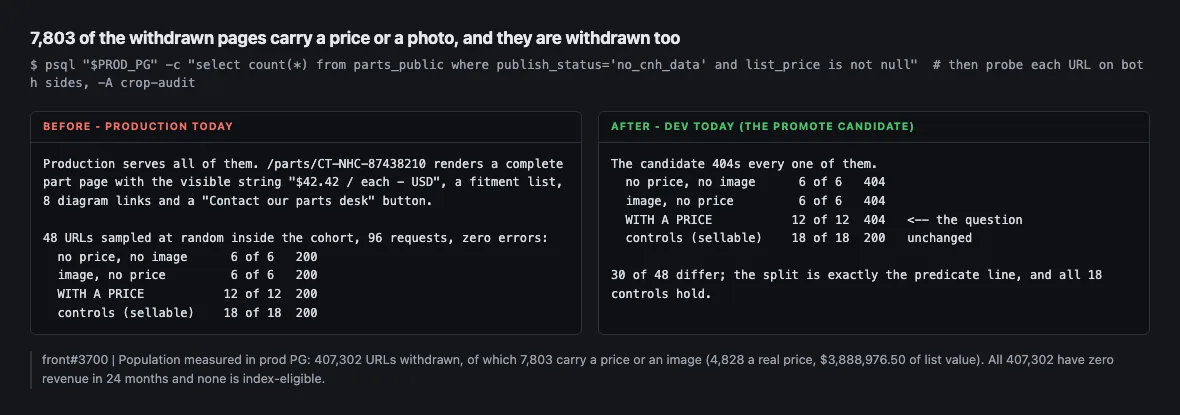
7,803 of the 407,302 withdrawn part pages carry a price or a photo, and they are withdrawn anyway must settlea customer can see thisfront#3700
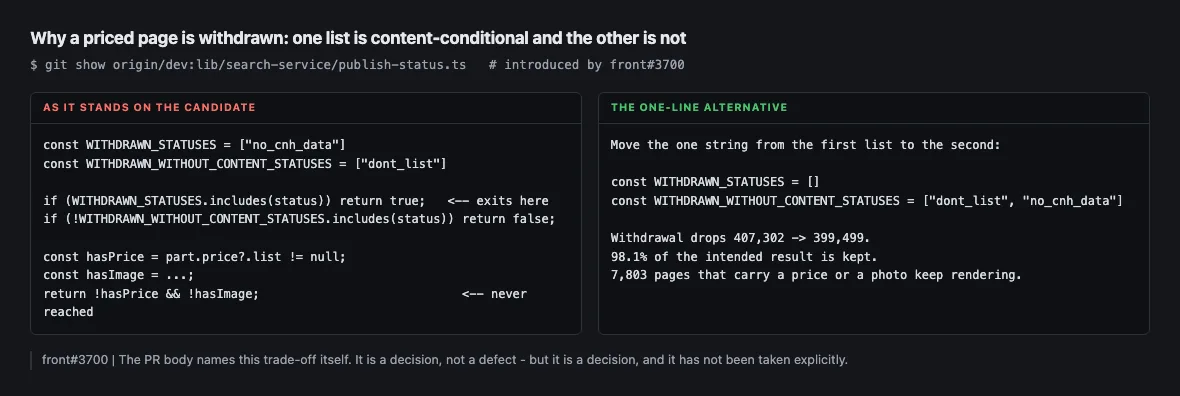
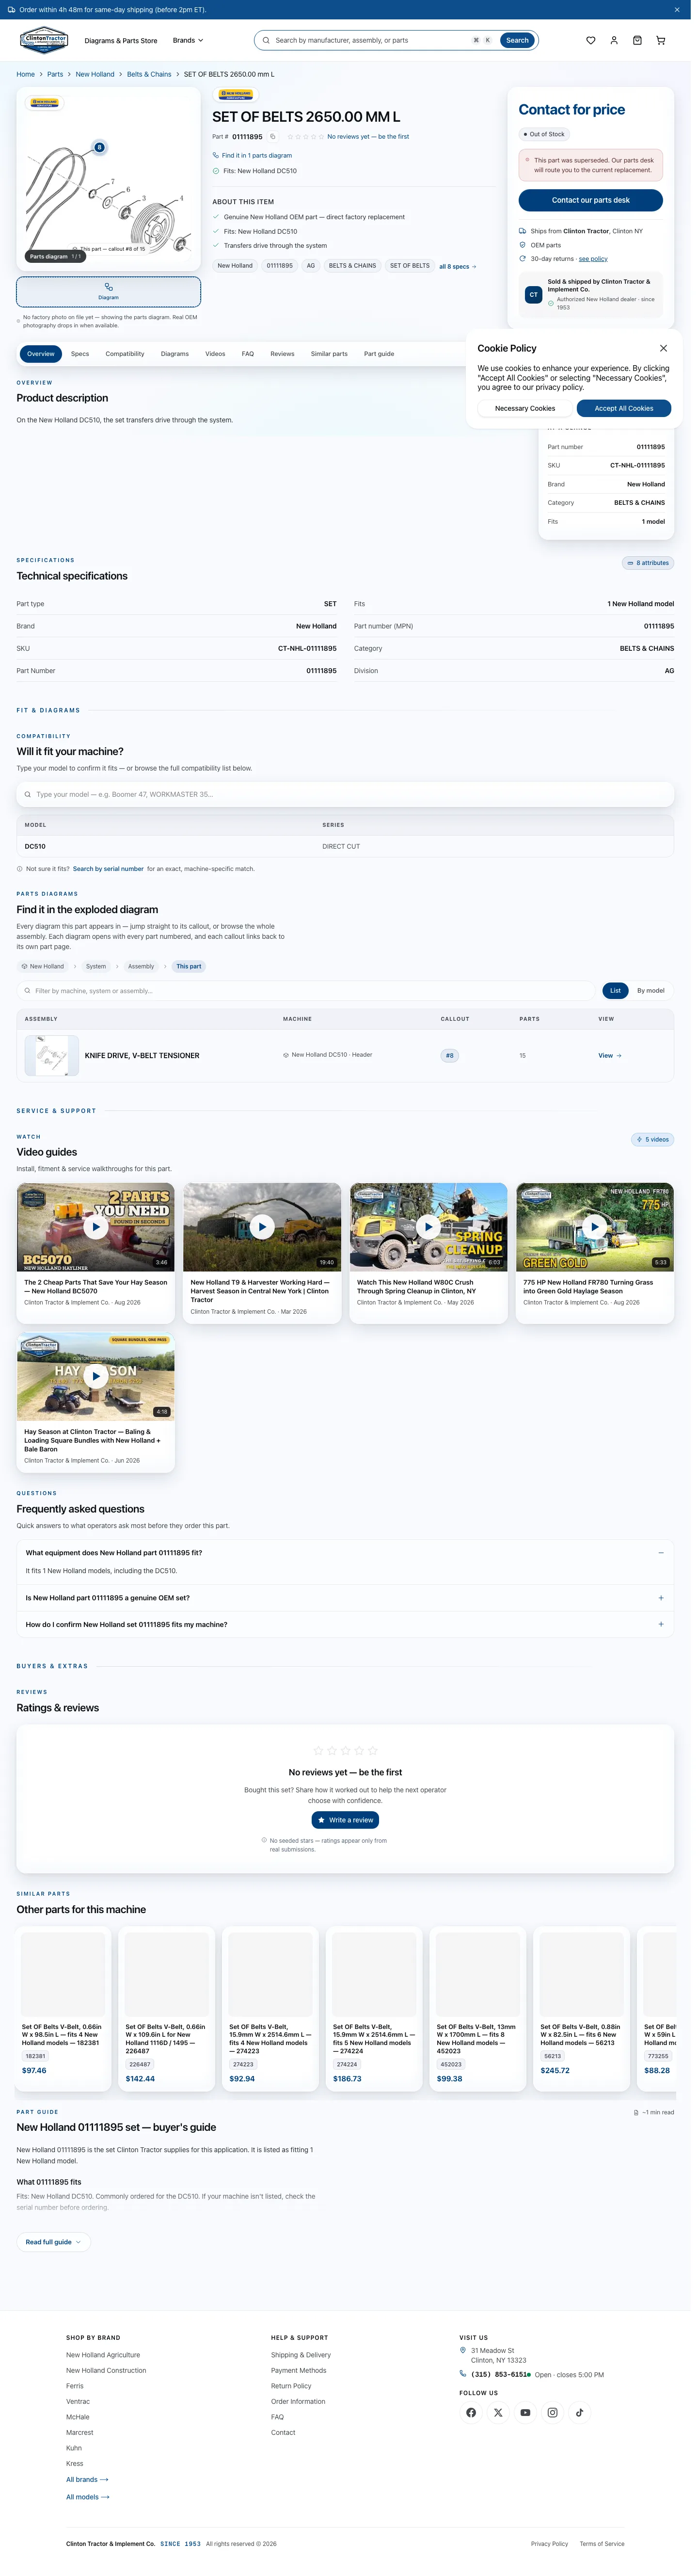
The largest change in this release takes 407,302 part pages that carry nothing — no price, no photo, no catalogue data — and makes them answer not-found instead of rendering an empty page. That is the intent and it is worth doing. But the rule has two lists in it, and only one of them checks whether the page has anything on it. 7,803 pages that do have something — 4,828 of them a real price, $3,888,976.50 of list value between them — are withdrawn as well.
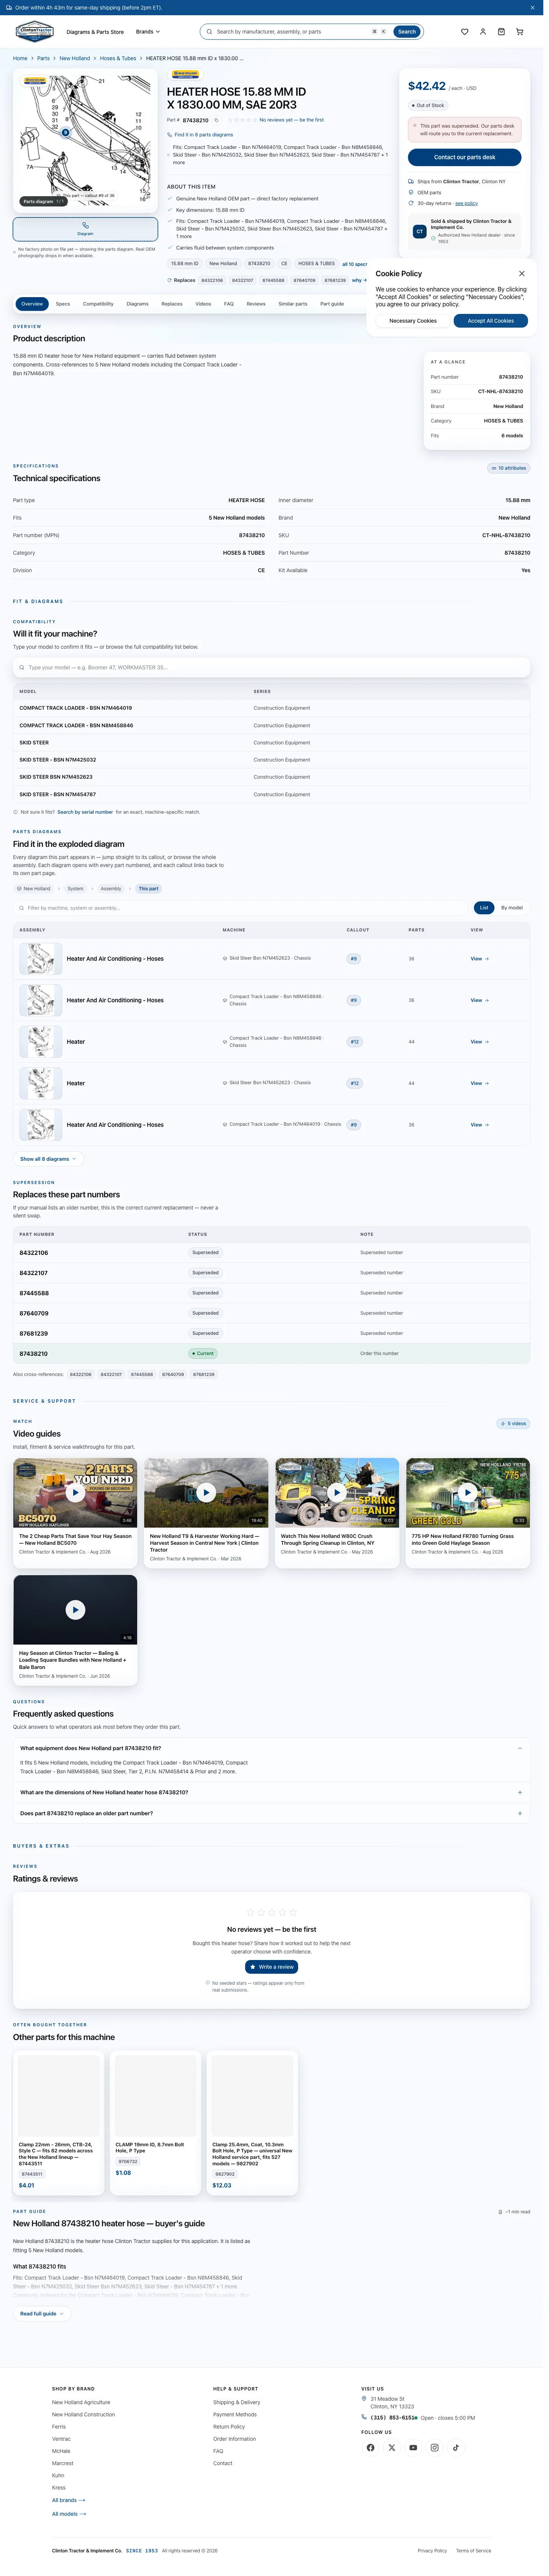
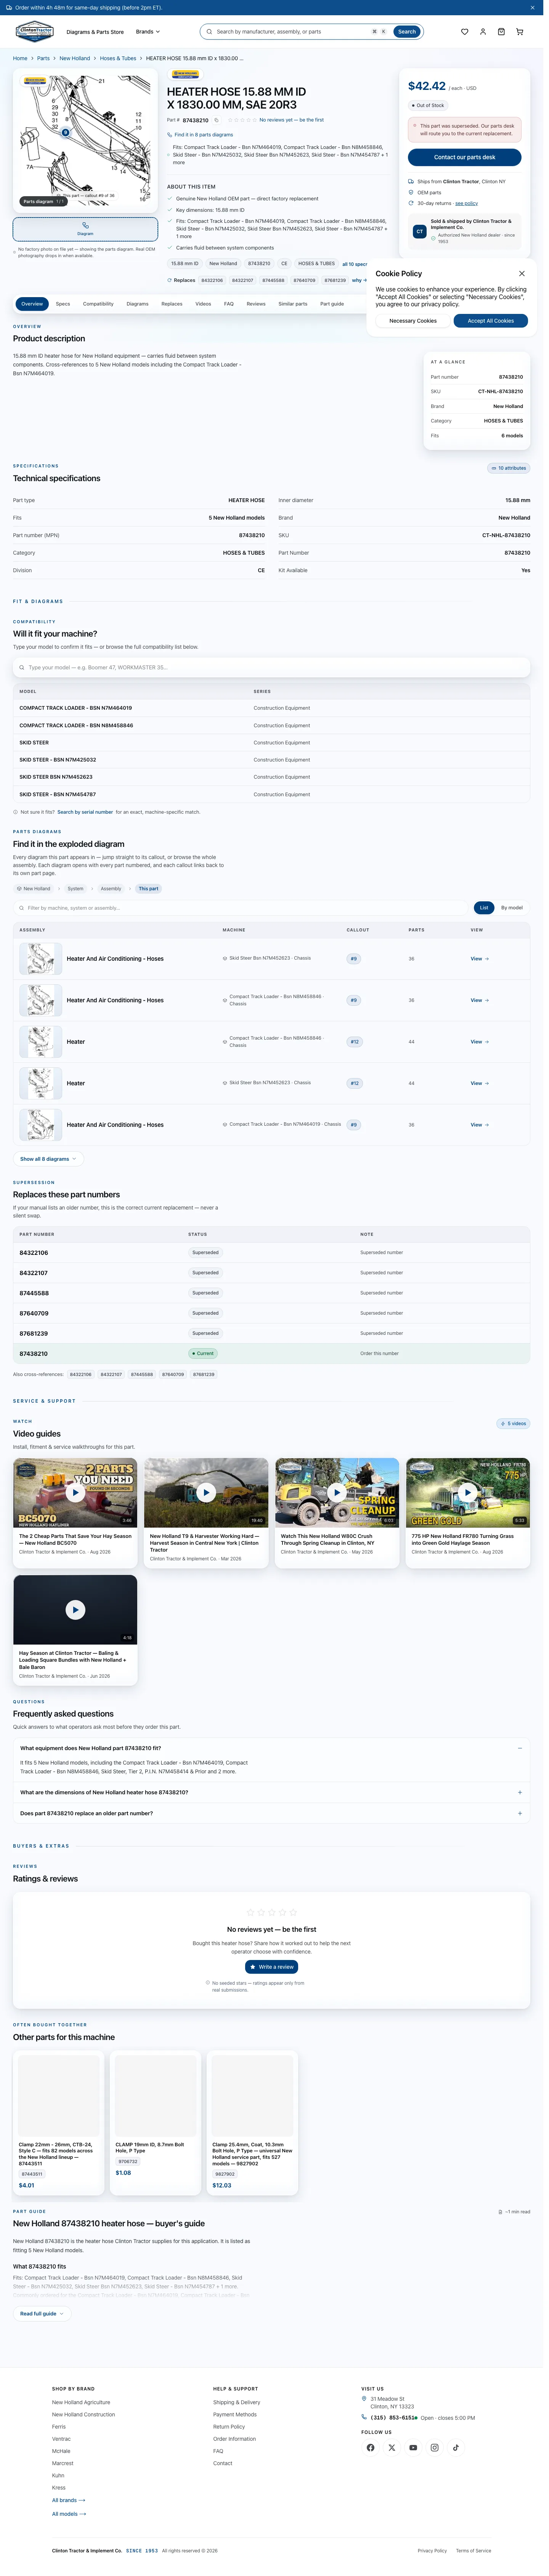
This was found on Thursday by opening one of them: a New Holland Construction part that production
serves today at $42.42 / each, with a fitment list, eight diagram links and a
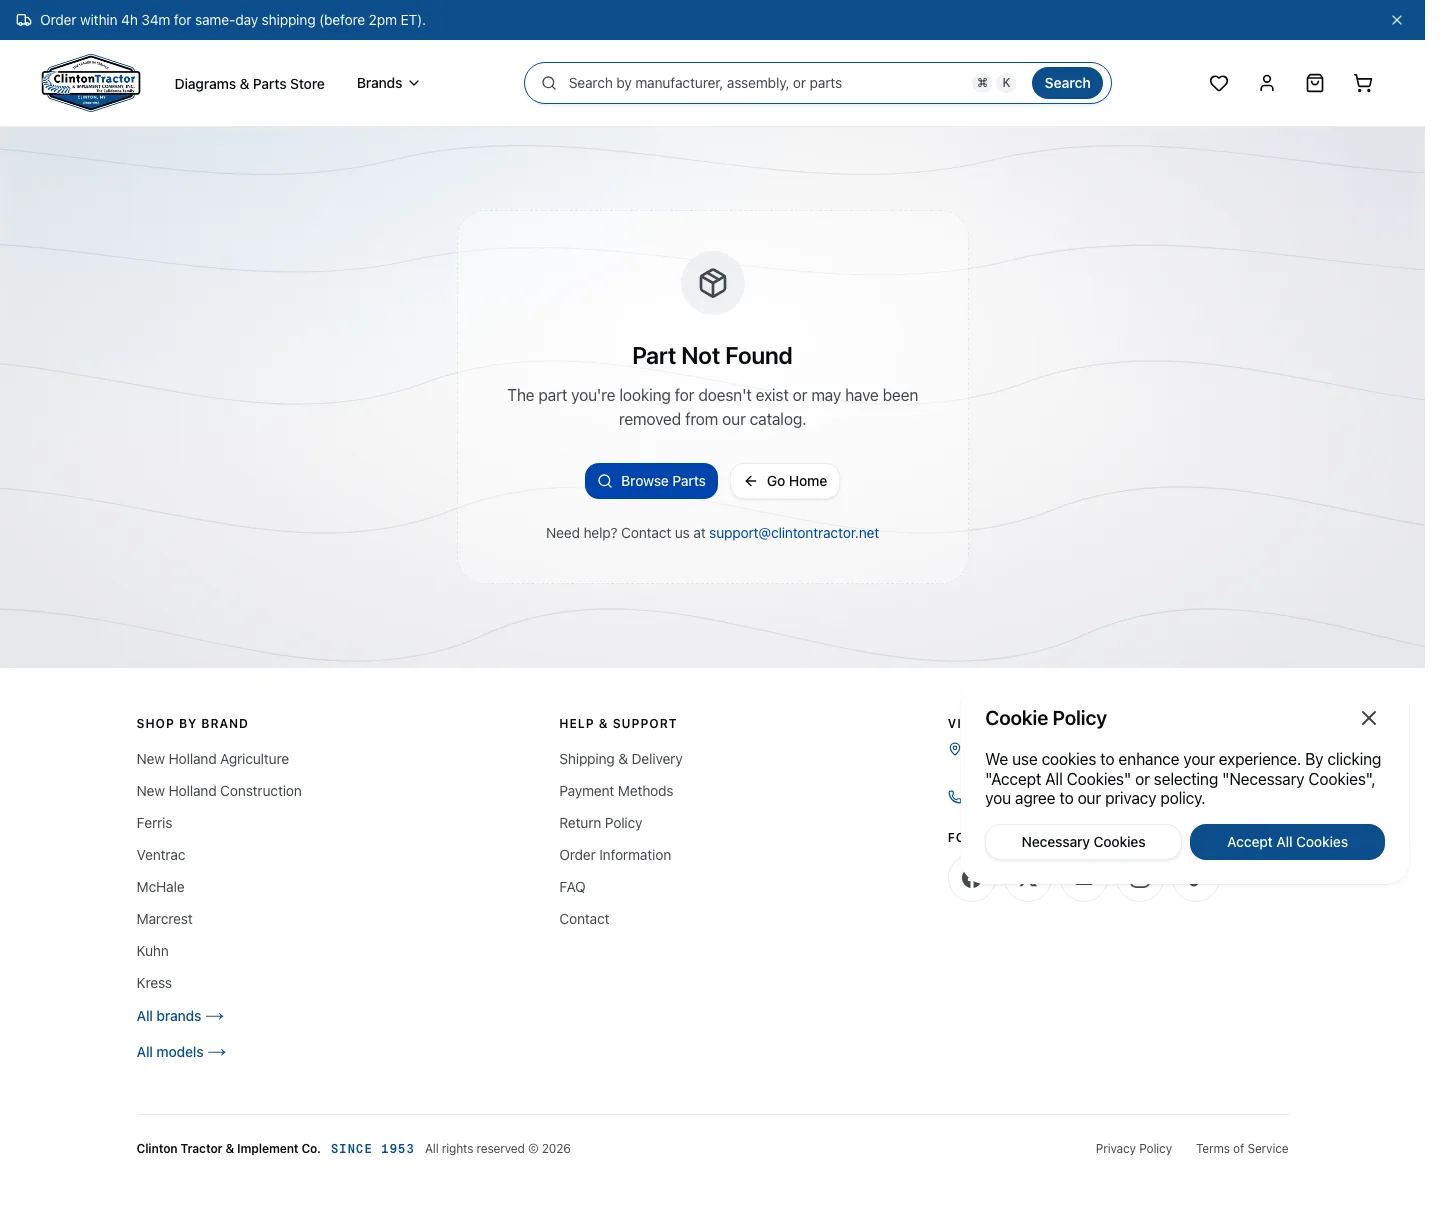
“Contact our parts desk” button. On the candidate the same address answers not-found.
What is true on the other side of it None of the 407,302 has taken an order in twenty-four months. None is offered to Google. None is findable in the store's own search. And the parts diagram already stops linking to them, so the promote creates no dead link and no broken buy path inside the store. What a customer loses is a page with a price and a phone number on it, not a way to buy anything.
The choice Ship it as it stands and accept that 4,828 priced pages stop existing — or move one word between two lists before Friday, which keeps 98.1% of the result and leaves those 7,803 pages rendering. The change was named in the pull request itself as the trade-off worth a second look; it has simply never been decided out loud.
One thing this does not answer: nobody has measured how many people actually open those 4,828 pages. That needs the search-console pull, and the cloud login for it had expired on Thursday — a missing measurement, not a zero.
The rest of what the call had to decide — 11 to settle before shipping, one of them since answered, 14 judgement calls
gcloud is NOT authenticated — every Cloud Run revision name is UNAVAILABLE, and I will not guess onemust settle
I could not read a single Cloud Run revision name, traffic split, env var, or service-level scaling value this session. The token is expired; per the standing rule an expired token is a false negative, never evidence of absence. What that leaves missing from the rollback surface: the currently-serving search-api revision name (the actual --to-revisions rollback target), whether latestReady == latestCreated on search-api today, whether any stale traffic tag is parked (billable, and it has happened twice), search-api's env vars (the image swap preserves env, so a var the new image requires and prod lacks = crash-loop), and every parts-services service's deployed image tag. Two facts I do have, from ops/docs/evidence/2026-08-20-search-promote-before.json captured at 07:35:01Z today while gcloud still worked: prod search-api runs image search-nest:2da1a51e3d98ffc37b4656a0f00bd6c44930cdab with scalingMode MANUAL / manualInstanceCount 2; search-api-dev runs crop-search:b92268a1a3551b8c7485ce9cf88995edce7231ed with maxInstanceCount 2. That is an image tag, not a revision name — a revision name cannot be derived from it.
What to doVova, after gcloud auth login, run exactly these and paste the output onto the change-control page: (1) gcloud run services describe search-api --region=us-east1 --format='value(status.latestReadyRevisionName,status.latestCreatedRevisionName)' (2) gcloud run services describe search-api --region=us-east1 --flatten='status.traffic[]' --format='csv[no-heading](status.traffic.revisionName,status.traffic.percent,status.traffic.tag)' — this names the rollback revision AND exposes any stale tag (3) gcloud run revisions list --service=search-api --region=us-east1 --format='table(name,active,creationTimestamp,spec.containers[0].image)' (4) gcloud run services describe search-api --region=us-east1 --format='yaml(spec.template.spec.containers[0].env)' — confirm IS_PUBLISHABLE_FILTER_ENABLED and every var the new config module requires (5) curl -s -H "Authorization: Bearer $(gcloud auth print-access-token)" https://run.googleapis.com/v2/projects/noted-bliss-466410-q6/locations/us-east1/services/search-api — the v2 REST call, because describe reports spec.scaling as null and HIDES the service-level instance cap (this is why ops/scripts/search-promote-check.ts uses REST) (6) gcloud run services list --region=us-east1 --format='table(metadata.name,status.latestReadyRevisionName,spec.template.spec.containers[0].image)' for the parts-services image tags (7) bun run ops/scripts/search-promote-check.ts to refresh the before/after instrument once auth is back.
The search rollback image is on a RETIRED registry path — a rollback that edits the tag on the new path resolves nothingmust settleCROP-search#915, CROP-search#916
The Artifact Registry path was renamed on 2026-08-19, mid-week, between the last promote and this one. Lineage from the #916 diff, which I read directly: search-hono-nest -> search-nest -> crop-search, all under us-east1-docker.pkg.dev/noted-bliss-466410-q6/cloud-run-source-deploy/. So the promote pushes crop-search:<dev sha> while the thing you roll back TO is search-nest:2da1a51e3d98ffc37b4656a0f00bd6c44930cdab — a different repository name, confirmed independently by this morning's evidence JSON. #916's own workflow comment says it: 'A rollback must use the path that SHA was built under, not this one.' The delivery-flow runbook repeats it. The trap is that swapping the tag on the crop-search path to 2da1a51e resolves to nothing and Cloud Build fails, at the exact moment you are trying to undo a bad promote. The safe rollback does not touch images at all: gcloud run services update-traffic search-api --to-revisions=<prev-revision>=100 --region=us-east1, because every revision stays routable by name until deleted. That needs the revision name, which is UNAVAILABLE (see the gcloud item).
What to doVova: before the swap, capture the currently-serving revision name and write BOTH the revision name and the full old image URI (us-east1-docker.pkg.dev/noted-bliss-466410-q6/cloud-run-source-deploy/search-nest:2da1a51e3d98ffc37b4656a0f00bd6c44930cdab) on the change-control page. Roll back by revision, not by image.
Prod is worse right now than the morning measurement, and the healthy control path has broken toomust settleCROP-search#924
Measured by me at ~12:54-13:05Z today, crawler UA, never-before-used query strings. Prod search-api /health — the cheapest endpoint there is, a DB ping with no federated fan-out — answered: timeout at 40s, timeout at 40s, then 200 in 38.77s. Dev search-api /health answered 200 in 0.62s with a healthy vocabulary cache. That is not the #895/#896 fan-out shape; /health does not do the fan-out. More important, the CONTROL path from #924 has failed over: https://crop.clintontractor.net/parts?page=10 returned 500 three times out of three (20.08s, 5.39s, 2.56s) where at 01:15Z it was 200 in 0.78-0.96s and was cited in #924 as proof that 'listing is healthy, only search fails'. It no longer is. Also measured: / = 200 in 5.53s, /parts (bare) = 200 in 4.61s, PDP /parts/CT-NHL-100074 = 200 in 19.11s. So per the brief's rule I am saying it plainly: I cannot separate 'the promote surface' from 'the live outage' today, because the outage now reaches the plain catalogue listing. Whatever before/after you take on Friday will be measured against a moving, degrading baseline — and the before/after window dies at the promote.
What to doVova: re-run bun run ops/scripts/search-promote-check.ts immediately before the promote to refresh the BEFORE, and treat the 07:35Z evidence JSON as stale. If /health is still 38s+ at promote time, decide explicitly whether the candidate gate can even be trusted to pass — a 40s /health will not survive smoke-candidate.sh.
stage was never cut for this train — it still holds the 2026-08-13 releasemust settle
The front weekly promote is merge stage -> main per docs/runbooks/delivery-flow.md. stage HEAD is e6b2f0f99, dated 2026-08-14T06:14:24Z, message 'chore(stage): re-cut release train 2026-08-13 from dev [preview]'. compare/main...stage = 2 ahead, 93 behind, 0 files changed; compare/stage...dev = 89 ahead. So stage carries last week's train and nothing from this week. Today is Thursday 2026-08-20, which is the cut day, and as of 13:00Z the cut has not happened. Everything downstream of the cut is therefore also not done: no QA pass on stage, and CROP-change-control holds only 2026-08-07.html and 2026-08-14.html — there is no page for this train, and that page is the material for John's five-minute retro.
What to doVova: cut stage from the frozen dev SHA today, or decide now that Friday is a search-only promote and say so — the front half cannot be validated on a stage that is 89 commits behind dev.
ANSWERED — the swap did not ship a stale artifact: the gate that failed was re-run the same afternoon and passedsettledCROP-search#925, #920, #922, #913, #910, #918, #923
The Friday promote image-swaps whatever artifact the DEV gate blessed. It did not bless dev HEAD. Run 32347365459 (Deploy search-api-dev, dev sha 678b7af2 = #925, 08:08Z today): 'Build image' success, 'Deploy candidate revision (no traffic)' success, 'Smoke + warm + contract gate vs candidate' FAILURE, 'Promote candidate to 100% traffic' SKIPPED, 'Delete un-promoted candidate on gate failure' success. The run before it (f5518b6b, 07:38Z) succeeded. So search-api-dev today serves the f5518b6b image — it has #920 (cache the three hottest assemblies routes) and #922 (Kuhn part_count) but NOT #925 (CNH assemblies fence). A third run (24b775a4, 07:38Z) also failed. This is the exact silent-staleness failure #910 documented: the workflow behaves as designed, nothing alerts, and the old revision keeps serving. ops/docs/2026-08-20-merchant-feed-promote.md adds the second half: smoke-candidate.sh runs against dev-crop-db, which IS prod PG, so a gate run inside a ~100% CPU window fails on plain browse and a rerun inside the same window is wasted. Friday 05:00 NY = 09:00 UTC read 97.9% max on 08-17 and 94.0% on 08-18.
What to doVova: before the swap, pull prod PG CPU for the preceding 30 minutes; if it is pegged, wait rather than rerun. Then re-run the dev deploy on dev HEAD and confirm gate -> promote -> terminal-page parity all green and latestReady == latestCreated. Only then swap. Decide explicitly whether you swap dev HEAD (needs a green gate) or the f5518b6b image (green, but without #925).
The production outage is live right now and it is wider than search — page 2 of the catalogue 500smust settleCROP-search#924, #874; CROP-front#3628, #3712, #3695, #3684
Measured 2026-08-20 ~13:00Z with never-before-used query strings. Prod /api/search: first probe no response at 45s, second 200 in 32.4s. search-api-dev on the SAME database: 200 in 5.67s and 4.00s. Prod /health itself took 39.6s; dev /health 0.60s. Storefront /parts?q=<fresh> 500 in 16.8s. New, and not in #924: /parts?page=2 500 in 3.1s and /parts?page=10 500 in 2.9s and 5.3s, while /parts page 1 is 200 in 4.7s and the home page is 200. #924 records 'Listing is healthy, /parts?page=10 200 in 0.81s' — that is no longer true, so the customer-visible surface is bigger than the issue says. Page 1 is CDN-cached; anything uncached fails. This also means a prod 500 on almost any catalogue path today is this outage, not a new regression — I could not separate the two on any uncached route.
What to doVova: the swap is the fix. Add /parts?page=2 to the acceptance in search#924 (it currently only covers ?q=) and re-measure it immediately after the swap. If page 2 does not recover, the outage has a second cause and Friday's other promotes should stop.
#3244 makes strict PDP indexing the code default, which deletes the ordering safety #3653 depends onmust settleCROP-front#3244, #3653
#3653 states the constraint in its own body: 'the two brand-hold lines must be on main BEFORE PDP_INDEXING_MODE=strict is set on prod — flipping the env first would open four unsigned-off brands (Kuhn / Ferris / McHale / Marcrest, 358 registry-eligible parts). Cherry-pick then env, in that order, on the 2026-08-21 train.' #3244 merged a day later and flips the DEFAULT to strict in lib/seo-config.ts, so once it is on main there is no env step left to hold back — strict arrives with the deploy. #3244 also kills legacyBrandHold (gated on mode !== strict) and says so. #3244's justification is 'PDP_INDEXING_MODE=strict is already set on prod, so prod behaviour is unchanged'. That claim does not survive measurement: prod /sitemap/1.xml carries 2,378 locs and 2,378 of them are CT-NHL-, zero FER/KUH/MCH/MAR; prod /parts/CT-FER-1608395 answers 200 with noindex, follow. By #3625's own strict-mode detector ('any non-CNH branded loc means the hold is off'), the hold is ON in production today. I could not read the Vercel env value to settle which of the two PRs is right — env values are not readable from here.
What to doVova: read the real PDP_INDEXING_MODE value in Vercel Production before the train (vercel env ls production, or the dashboard). Then either cherry-pick #3653 and #3244 as one changeset, or hold #3244 back entirely. #3244 alone opens four brands John has not signed off.
ps#615 must not reach production before the search image swap — it would extend the checkout outage to Express Checkoutmust settleCROP-parts-services#615; CROP-search#924
#615 adds validateCheckout to POST /payment-intent — the Apple Pay / Google Pay / Link path — which issues one GET /api/parts/:id per cart line against the search service and fails CLOSED. Prod search answers cold in 32s today; payment-service's fetchPartPrice has a 5s timeout. The hosted checkout page already fails exactly this way: ops/docs/2026-08-20-checkout-blocked-by-pg-saturation.md records crop-checkout-probe (a real POST /api/checkout/session against production every 30 min) failing three scheduled executions on 08-19 with 'Could not verify price for CROP-SYNTHETIC-PROBE (search API timeout)', p0 policy, alert fired five times, nobody came. Express Checkout is currently the one payment path that still works, precisely because it does not call the catalogue. Promoting #615 first removes that.
What to doVova: search-api image swap first, verified green on a fresh cold query, then ps#615. The sequence is not negotiable. If the swap slips, ps#615 slips with it.
The promote runbook's QA sign-off gate has no owner — Denis left todaymust settlewhole train; CROP-front#3565, #3562; CROP-search#891, #909; CROP-parts-services#624, #613, #615
ops/docs/2026-08-20-merchant-feed-promote.md lists as a hard gate: 'Denis's explicit QA sign-off on stage — hard gate. No sign-off, no promote, the train waits a week.' Denis departed 2026-08-20. Seven of this week's dev merges carry Driver: @denistka, including two customer-visible availability changes (front#3565, search#891) and two revenue-path changes (ps#615, ps#624). Nobody is named to sign off on stage on Friday, and a gate that passes by default is worse than no gate.
What to doVova: before Friday, either name yourself as the stage sign-off and do the pass, or delete the gate from delivery-flow.md and record what replaces it. Do not let the train roll with the box unticked and unnoticed.
The strict-indexing default and the brand hold are two separable cherry-picks; picking one opens four unsigned-off brandsmust settleCROP-front#3244, CROP-front#3653
front#3653 (merge 65e71f00c7, 08-18) made the brand hold mode-independent; front#3244 (merge fa60043144, 08-19) flipped PDP_INDEXING_MODE's default from legacy to strict. They are separate commits and the house rule is individual cherry-pick PRs, so they can land apart. Verified on origin/main today: lib/seo-config.ts still returns "legacy" by default, lib/seo/pdp-index-hold.ts starts with if (PDP_INDEXING_MODE === "strict") return false;, and app/parts/[id]/page.tsx:223 gates legacyBrandHold on PDP_INDEXING_MODE !== "strict". On origin/dev both exemptions are gone and isBrandHeldSku is unconditional. So cherry-picking #3244 alone = Kuhn/Ferris/McHale/Marcrest PDPs plus both sitemap surfaces go index,follow — #3653 puts that at 358 registry-eligible parts John has not signed off. The two PR bodies argue opposite conclusions: #3244 calls the hold going dead "intentional and correct", #3653 calls it four unsigned-off brands. A reviewer reading only #3244 would approve it standalone. Second trap: #3653's runbook line "cherry-pick then env, in that order" is now half-stale — #3244 absorbed PDP_INDEXING_MODE=strict into code, so the pick itself is the flip and there is no env gate left on that half. The env step that genuinely remains is ENABLE_EQUIPMENT_TREE_NOINDEX=true (still === "true", default off, verified on dev). No open issue carries this coupling; #2912 and #3594 are both closed.
What to doVova: assemble the 08-21 front train so lib/seo-config.ts, lib/seo/pdp-index-hold.ts and app/parts/[id]/page.tsx land in ONE cherry-pick PR, and correct the ordering line in docs/seo/index-open-runbook.md before anyone follows it. After promote, curl -A crop-audit a KUH/FER/MCH/MAR PDP and confirm noindex, follow.
search#924 gates the front train twice over: prod is 500ing Googlebot on its own sitemap URLs, and dev CI build is red on the same 429smust settleCROP-search#924 (issue), CROP-front#3715, CROP-front#3707
Measured today with -A crop-audit against production: /robots.txt 200 in 0.66s, /sitemap/1.xml 200 in 0.34s advertising 2,378 PDP locs, / 200 in 6.4s — but /parts?q=<never-used-string> returned 500 in 20.2s, /parts/CT-NHL-219758 gave no response inside 40s, and /parts/CT-NHL-100016 (taken straight from that sitemap) took 19.0s to answer 200. A Ferris PN returned 500 at 63s on one probe. So the entire indexable surface we submit is currently answering slowly or erroring to a crawler. Separately, front dev HEAD (ce2513b7) has build, lint-and-build and crawl-preview all failing: run 32348291522 job build at 08:33Z shows /api/brand/{mchale,marcrest,new-holland-agriculture,ferris,kuhn,kress,landoll}/equipment-types each returning errorStatus 429, retry-exhausted, adaptive-backoff healthy -> recovering. That is the same prod-search dependency front#3707 is filed for. Consequence nobody has written down: no cherry-pick PR to main can go green while dev CI is red on this, so the front train is downstream of the image swap, not parallel to it. ops/scripts/search-promote-check.ts exists and its before-window is already captured (ops 1960680).
What to doVova: do the search#924 image swap first, verify with bun run ops/scripts/search-promote-check.ts (status before latency; novel query string), then re-run front CI on dev and only then assemble the train.
Two different front promotes are both sitting 'queued', and they are not the same changejudgement callCROP-front#3680, #3679, #3675, #3662, #3638
Route A, the runbook's weekly train: merge stage -> main, which after a fresh cut carries compare/main...dev = 88 commits / 300 files. That is the whole week — the SEO train (#3653, #3700, #3661), the merchant feed widening (#3655, #3650, #3690), the availability and PDP work, the CI restructuring. Route B, what is actually open against main right now: five cherry-pick PRs, #3680, #3679, #3675, #3662, #3638 — every one of them a CI or gate fix (sitemap-seo-gate cold start, scheduled-lane reds, stage-target preflight, brand-hold subtraction, Vercel automation bypass). Not one of them touches customer-facing code. Worth noting explicitly: none of the front fixes for the current outage — #3712 (answer a transient search failure like an outage, not a 500), #3684 (a search outage must not read as a discontinued catalogue), #3628 (degraded listing reaches a crawler as 503, not 500) — has a cherry-pick PR open. They are dev-only. So the storefront's own resilience to a search outage does not reach production on Route B.
What to doVova: state which route Friday is, out loud, before the call. If it is Route B, say plainly that the storefront keeps 500-ing on a search failure because #3712/#3684/#3628 are not in it.
One-way: 407,302 PDPs become edge 404s, and it is not behind a flagjudgement callCROP-front#3700, CROP-front#3710
Answer to question 3, first genuine item. #3700 turns 407,302 part pages into an edge 404 in lib/proxy/supersession-redirect.ts. I grepped its full diff for a gate — process.env appears exactly once, as deps.baseUrl ?? process.env.SEARCH_SERVICE_URL. There is no feature flag: this ships on promote. The outward-state part is Google's crawl: URLs crawled and served 404 during the live window are a signal already sent, and a code rollback does not recall it. Two things bound the damage, both measured in the PRs themselves rather than assumed. First, all 407,302 are already is_publishable=false and already noindex per #3700's body, so the indexed set barely moves — this is crawl-budget work, not de-indexing of ranking pages. Second, #3710 deliberately caps the edge TTL at s-maxage=300 (it would otherwise inherit /parts-not-found's s-maxage=3600 + 24h stale-while-revalidate), so a rollback restores 200s within five minutes instead of a day. The 13,626 dont_list rows that carry a price or an image stay 200.
What to doVova: accept or hold this one explicitly on Friday. If accepted, note on the change-control page that rollback is code-plus-five-minutes at the edge, not instant, and that #3710 is what makes that true — it must ship in the same promote as #3700, never after it.
parts-services is not in this promote, and its 8 unpromoted commits include two money pathsjudgement callCROP-parts-services#615, #624, #620, #621, #622, #618, #619, #613
compare/main...dev = 8 commits ahead, 56 files. main HEAD be865716b dates from 2026-08-14T07:07:30Z (#616, the 08-13 train); dev HEAD 38352042f from 08-18. Two of the eight touch money. #615 (3323f61c7) re-prices the express-checkout cart against the catalogue before charging — it changes services/payment/src/routes/payment-intent.ts, i.e. what a customer is charged; #624 (38352042f) stops a UPS reply with no charge block being quoted as free shipping. Neither is one-way by itself (no outward write is added; per standing rule our code never calls Stripe for refunds), but both alter what a customer is told and charged, so a rollback after real orders leaves those orders priced by the version that was live. #620 is the Bun 1.3.9 -> 1.3.14 bump that is the cure for the TLS leak OOMing four services — arguably the one you most want in prod. Separately, four promote PRs to main have been queued since 08-11/08-12 and have not moved: #600 (Mongo idle-connection churn / OOM), #596 (/rates cache-write P0), #595 (the backfill script), #594 (photo-upload brand_code). Note the runbook's own warning: git log origin/main..origin/dev over-reports here — it says 8, git cherry -v by patch-id says 6.
What to doVova: decide whether parts-services rides Friday at all. If yes, they are individual cherry-picks from the frozen train SHA, never a dev->main merge, and #620 goes first since it is the OOM cure. If no, say so — #596 and #600 have been queued for nine days and that should be a decision, not a drift.
The runbook's hard QA gate has no owner, and zero release-blockers is the only gate that is actually clearjudgement call
docs/runbooks/delivery-flow.md names three gates before a promote: Denis's explicit QA sign-off on stage (hard — no sign-off, no promote, the train waits a week); zero open release-blocker issues; and no prod deploy during working hours. I checked the second one: gh issue list --label release-blocker --state open across CROP-front, CROP-search and CROP-parts-services returns nothing — that gate is clear. Two open sale-blocker issues exist in CROP-search: #924 (which IS this promote) and #146 (the BOM description fitment bug, John-classed, unrelated). The first gate is the problem — the QA lane is unowned, and there is no stage build to sign off on anyway (see the stage item). The last promote already went out of the working-hours window on Vova's call and was logged in ops/docs/change-control/emergency-log.md.
What to doVova: decide who signs off, or decide explicitly to waive the gate for a search-only promote and log the waiver in emergency-log.md the way the 08-14 out-of-window promote was logged. An unowned hard gate that everyone quietly steps over is worse than a waived one.
The image swap is all-or-nothing: 27 commits ride with the latency fixjudgement callCROP-search#924 (carrying #891, #904, #906, #910, #913, #920, #922, #925 and the rest)
search#924 states the trade in its own words: 'An image swap is all-or-nothing: promoting carries all 27 commits, not just #896/#897. SEO-train work, the merchant-feed change (#904) and the availability depot-axis change (#891) ride along. That is the decision to weigh; it is not a reason to leave a 16.5s search in production.' There is no way to take the latency fix alone. Prod search-api currently runs search-nest:2da1a51e (per the 07:35Z baseline in ops/docs/evidence/2026-08-20-search-promote-before.json).
What to doVova: accept the bundle or don't swap. If you accept it, items 7, 10 and 15 below are the three riders that actually change what customers see, and they should be named at the meeting rather than discovered afterwards.
search#891 flips diagram availability for a cohort nobody counted, and the author asked for the number before mergejudgement callCROP-search#891; CROP-front#3562
#891 stops the parts diagram resolving stock from the retired cnh_orderability axis and reads the depot signal through the catalogue tile's own resolveRowAvailability. Known cohort: 127,404 publishable rows flip from a green In Stock chip to Out of Stock on the diagram (that number comes from the #708 work, not from this PR). The PR is explicit that the change is WIDER than that: any BOM row with no depot reading and Material Status GREEN previously read in_stock and now reads unclear — 'it is a second population, it is not 127,404, and nobody has counted it'. The body ends '@appdev-v — please run those [two SQL counts] before merging.' It merged 2026-08-16 without them. front#3562 adds the storefront-side guard so the Add-all-in-stock CTA cannot re-open it, and needs no separate decision.
What to doVova or Alex: run the two counts in the #891 body against prod PG before the swap. The second number (green chip -> 'we don't know') is the one John should hear, and it is the one nobody has.
#3700 404s 407,302 part pages, and #3710 is the only thing bounding a mistake to five minutesjudgement callCROP-front#3700, #3710
These two only work together. #3700 edge-404s all no_cnh_data plus the price-less, image-less dont_list rows: 407,302 URLs go from 200 / 286 KB / 11.2s to 404 / ~104 KB / under a second. Deliberate but not free: 7,804 of the 75,048 no_cnh_data rows DO carry content (4,829 priced, 3,841 imaged) and 404 anyway — the PR flags this itself as 'the one number here that isn't obviously free', and making it content-conditional is a one-line change to WITHDRAWN_STATUSES. publish_status is recomputed NIGHTLY, so a URL can legitimately move 404 -> 200 -> 404 across nights. #3710 caps the CDN TTL at s-maxage=300; without it the 404 inherits s-maxage=3600 + stale-while-revalidate=86400 (measured on dev: x-vercel-cache HIT, age 84), so a part that becomes sellable overnight keeps answering 404 for up to 25 hours.
What to doVova: decide whether the 7,804 content-bearing no_cnh_data rows 404. Then ship #3700 and #3710 in the same changeset or neither. After the promote, watch pdp.unpublishable_404 for a step change, not drift.
#3653 is the only PR that ticks 'goes to production this week', and its effect needs two env vars set by hand after the code landsjudgement callCROP-front#3653 (with #3244)
Gated behind PDP_INDEXING_MODE=strict and the new ENABLE_EQUIPMENT_TREE_NOINDEX (default off, registered in .env.example + lib/seo-config.ts, NOT lib/env.ts — the Vercel value is part of the train). Nothing changes on merge; both switches are off/legacy today. Measured on prod now: the sitemap advertises 18,657 URLs — shard 0 = 16,279 locs of which 16,250 are /equipment*, shard 1 = 2,378 PDPs. After the flip it drops to ~2,407 (2,378 PDP + 16 brand listings + 2 brand hubs + 11 static), and 352,201 PDPs + 8,126 equipment pages + 8,124 diagram hubs move from index,follow to noindex,follow. Every one of those pages still answers 200 and is still findable by on-site search. Rollback is env-only with no deploy: PDP_INDEXING_MODE=legacy, ENABLE_EQUIPMENT_TREE_NOINDEX=false, restore DIAGRAM_NOINDEX_PILOT_FAMILIES, redeploy the current build.
What to doVova: set both vars in Vercel Production AFTER the code lands, not before. Tell John the sitemap number moves 18,657 -> ~2,407 before he sees it in GSC, and that the prepared list grows back toward ~11,800 with no further code change.
The merchant feed is a two-repo pair with a hard order: backend first, or the feed 503sjudgement callCROP-search#904; CROP-front#3655, #3690, #3661
search#904 repoints the feed source from indexable_parts_v1 + merchant_eligible (which requires clinton_on_hand > 0, hence the 2,684 ceiling) to part_indexing_candidates_v1 + image/offer/commerce gates: 97,578 rows, shard width 5,000 -> 25,000. front#3655 rewrites the route against it: 4 shards of 25,000, canonical-SKU ids, >=500x500 gallery images, mapped Google categories, g:shipping dropped. ops/docs/2026-08-20-merchant-feed-promote.md: 'search-api first, front second. The front's batchSize tripwire 503s the feed if the front arrives before the backend it calls.' Measured on prod now: /feed/google/0.xml = 2,632 items served in 0.28s, /feed/google/1.xml = 503, /feed/google/inventory/0.xml = 404 — neither half is live. front#3690 fixes five more empty-string/encoding defects that #3655 itself introduced and must ride with it. If a hotfix cherry-pick is used instead of the stage->main train, the closure is three commits IN ORDER — b90bac5ae first (it adds canonicalSkuPath, which main lacks; without it the other two cherry-pick clean and then fail to compile) then a97fb36a4 then 4c5f8456f, plus #3690.
What to doVova: backend swap, verified, then front. Run bun run scripts/merchant-feed-audit.ts against prod immediately after. Note the Merchant Center account has never been created (console-only, yours) — the feed can be perfect and reach nobody until it exists.
The widened feed advertises prices that have not refreshed since Apriljudgement callCROP-front#3655; hub#305
#3655 states it plainly: the price load is a one-time April import, average age ~95 days, and 15,345 sellable parts are priced BELOW live CNH (ops/docs/evidence/2026-07-20-nh-price-correctness.md). Going from 2,635 to 97,578 items does not create the problem but multiplies the exposure by 37x. Tracked with Alex as hub#305, unresolved. Separately, 1,584 of the 97,578 are federated brands whose PDPs return 200 with noindex, follow — 353 of them are already in today's feed, so they stay in, but the reason codes want checking at the first Diagnostics read.
What to doVova: decide whether the feed goes live before hub#305 closes. If yes, say the number out loud at the meeting — 15,345 parts priced under live CNH — so it is an accepted risk and not a discovery.
#3568 changes what Googlebot receives on every page, with no flag and no way to hold it backjudgement callCROP-front#3568 (with #3621, #3628)
Googlebot is taken off Next's blocking bot render and onto the CDN path. Measured on prod: Googlebot got x-vercel-cache BYPASS at 0.87-4.52s against a browser HIT at 0.20-1.40s, with byte-identical head and body — so the blocking render bought nothing and capped crawl rate. The htmlLimitedBots override and its drift-check workflow are deleted. This is a sitewide crawler-behaviour change that lands the moment the code deploys; there is no env switch. Two subtrees keep the old blocking render on purpose (/parts-diagrams/<brand>/<model> and /brand/<slug>) because their 404 exists ONLY because of the bot render — #3621 moves both to the edge and is also on dev, which is what lets the exception eventually go. Audit UAs including crop-audit come off the blocking path too, so probe timings before and after are not comparable.
What to doVova: accept it as part of the SEO batch or hold the whole SEO batch. If it ships, book the saving from a full billing day of production bot-vs-human latency after the promote, not from a preview — #3568 says so itself.
The 500-to-503 PDP fix closed its issue on the dev merge and is not on prod, where the defect is live right nowjudgement callCROP-front#3712, CROP-front#3695
front#3712 merged to dev at 08:08Z today and makes /parts/[id] render ServiceUnavailable on a transient 429/5xx/timeout, which the edge re-labels 503 + Retry-After: 300 for crawlers instead of a hard 500. Its own evidence block records three prod probes at 07:35Z: 500/34.9s, no-response/45s, 500/27.1s on CT-NHL-100016. front#3693 is CLOSED (08-20). My probes four hours later still show 500s and 19-40s waits on prod, so the behaviour #3693 described is still what Google is getting — the fix exists only on dev and its tracking issue is shut. I cannot separate how much of today's 500 rate is the search outage versus anything else: both surfaces fail on the same upstream, and the storefront 500s on exactly the queries the search API refuses.
What to doVova: decide Friday whether #3712 rides the train. Note it is defence-in-depth — the search#924 swap removes the trigger — but it is the only thing that stops a future 429 burst from re-teaching Google that indexed PDPs return 500.
#2912 and #3594 are closed, but the measurement that proves them is explicitly post-promote and nothing open holds itjudgement callCROP-front#3244, CROP-front#3653
Both issues closed on their dev merges. #3244's body: "the sitemap/PDP count convergence measurement is a verify-phase activity post-promote". #3653's body: "The after-numbers are gated on the env flip, so they land with the Friday train, not here." The claim being verified is real and specific — 352,201 PDPs answering index,follow against a sitemap advertising 2,378, converging to ~2,407 indexable URLs — and I confirmed prod's sitemap/1.xml still carries exactly the 2,378 pre-change locs. Epic #2370 is open but names none of this. So the promote-and-verify step for the largest SEO change in the train belongs to no ticket, and #3653's four-step curl verification block will be the only place it is written down once the PR scrolls out of view.
What to doVova: before the train, file one issue (or reopen #3594) carrying #3653's four verification curls plus the sitemap loc count, assigned to yourself with a post-promote date.
Four parts-services PRs have sat queued against main for 8-9 days, including the OOM fix, and the Bun cure's only pass check is an unread soakjudgement callCROP-parts-services#620, #600, #596, #595, #594
parts-services main HEAD is still be865716 (08-14, train 2026-08-13). ps#600 (cherry-pick of #597, the maxIdleTimeMS half of the leak) has been open since 08-12 and did not go on 08-14; its own body says the alert has been open since 08-12T09:56Z and user-service is OOM-killed roughly daily. ps#620 (Bun 1.3.9 -> 1.3.14, the residual TLS leak) merged to dev 08-17 with measured leak rates of 2.87-4.43 MiB/h across user/delivery/payment/catalog and OOM kills on 08-15 and 08-16; its stated pass check is not a test but a dev soak — watch run.googleapis.com/container/memory/utilizations on the *-dev services and compare the slope against that baseline. Whether that soak has been read is UNAVAILABLE: gcloud is not authenticated in this session (expired token), and I am reporting that as unmeasured, not as zero. Also queued since 08-11: #594 (photo-upload 500ing since 06-10), #595 (documents still on Mongo), #596 (rate quote held behind a cache write). ps#589 is open, so the leak itself is tracked; what is untracked is who reads the soak and by when. ps#600 also warns: keep revision recycling armed for user/payment/delivery/catalog until the Bun bump lands.
What to doVova: gcloud auth login and read the *-dev memory slope against the 2.87-4.43 MiB/h baseline before Friday. If flat, promote #600 and the Bun bump together and stand down the recycling; decide the same day whether #594/#595/#596 ride or get dropped from the queue.
When something upstream breaks — 8 changes, 7 a customer or Google can notice
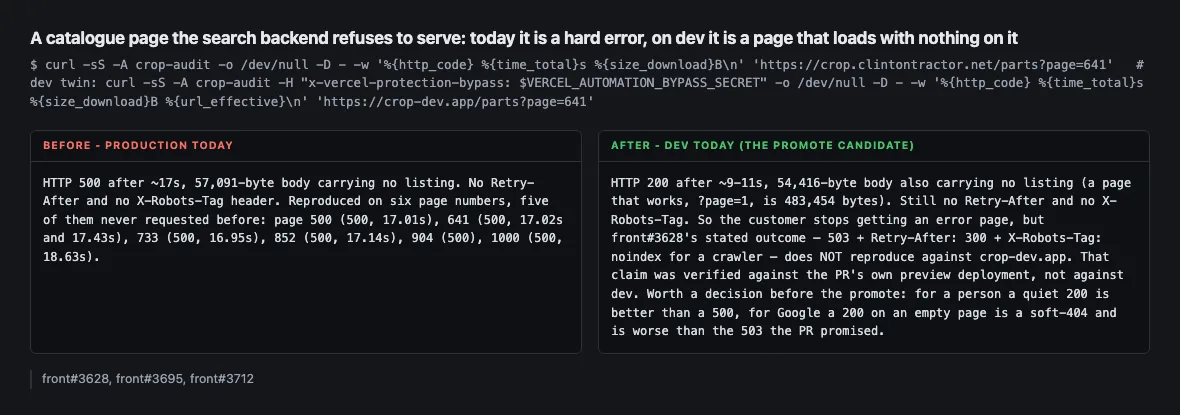
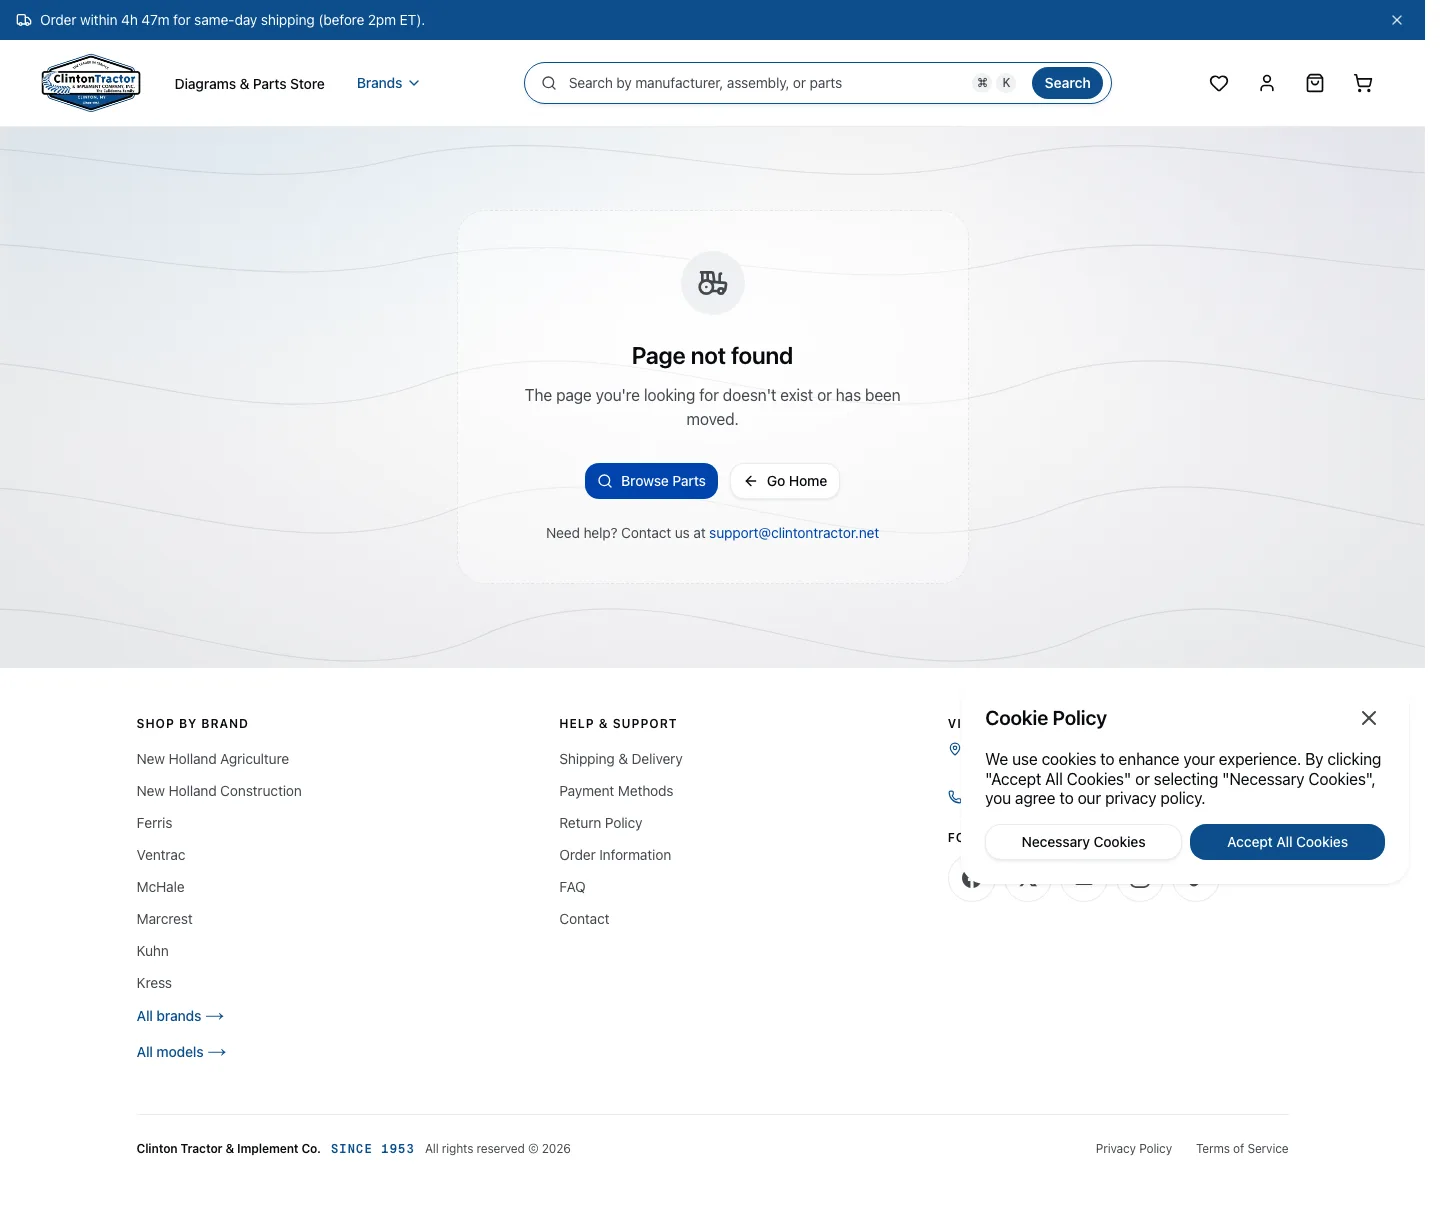
A catalogue page the search backend refuses to serve: today it is a hard error, on dev it is a page that loads with nothing on itmeasureda customer can see thisfront#3628, front#3695, front#3712
Before — production todayHTTP 500 after ~17s, 57,091-byte body carrying no listing. No Retry-After and no X-Robots-Tag header. Reproduced on six page numbers, five of them never requested before: page 500 (500, 17.01s), 641 (500, 17.02s and 17.43s), 733 (500, 16.95s), 852 (500, 17.14s), 904 (500), 1000 (500, 18.63s).
After — the candidate todayHTTP 200 after ~9-11s, 54,416-byte body also carrying no listing (a page that works, ?page=1, is 483,454 bytes). Still no Retry-After and no X-Robots-Tag. So the customer stops getting an error page, but front#3628's stated outcome — 503 + Retry-After: 300 + X-Robots-Tag: noindex for a crawler — does NOT reproduce against crop-dev.app. That claim was verified against the PR's own preview deployment, not against dev. Worth a decision before the promote: for a person a quiet 200 is better than a 500, for Google a 200 on an empty page is a soft-404 and is worse than the 503 the PR promised.
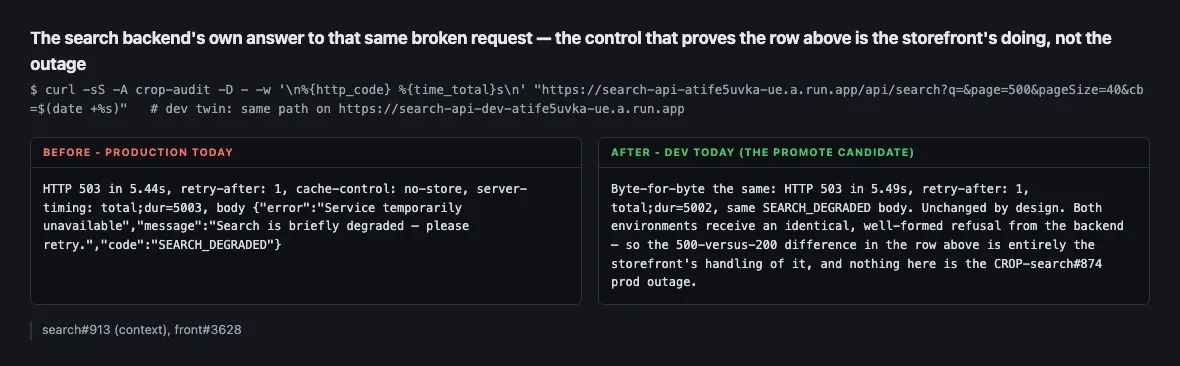
The search backend's own answer to that same broken request — the control that proves the row above is the storefront's doing, not the outagemeasuredsearch#913 (context), front#3628
Before — production todayHTTP 503 in 5.44s, retry-after: 1, cache-control: no-store, server-timing: total;dur=5003, body {"error":"Service temporarily unavailable","message":"Search is briefly degraded — please retry.","code":"SEARCH_DEGRADED"}
After — the candidate todayByte-for-byte the same: HTTP 503 in 5.49s, retry-after: 1, total;dur=5002, same SEARCH_DEGRADED body. Unchanged by design. Both environments receive an identical, well-formed refusal from the backend — so the 500-versus-200 difference in the row above is entirely the storefront's handling of it, and nothing here is the CROP-search#874 prod outage.
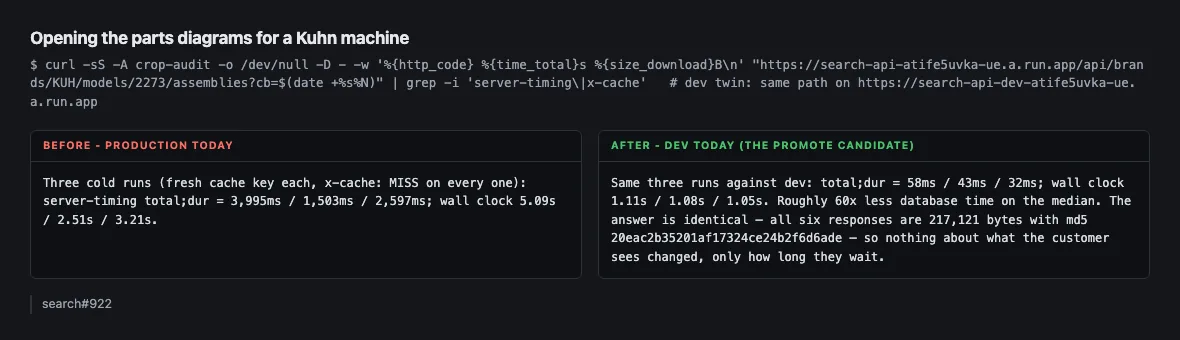
Opening the parts diagrams for a Kuhn machinemeasureda customer can see thissearch#922
Before — production todayThree cold runs (fresh cache key each, x-cache: MISS on every one): server-timing total;dur = 3,995ms / 1,503ms / 2,597ms; wall clock 5.09s / 2.51s / 3.21s.
After — the candidate todaySame three runs against dev: total;dur = 58ms / 43ms / 32ms; wall clock 1.11s / 1.08s / 1.05s. Roughly 60x less database time on the median. The answer is identical — all six responses are 217,121 bytes with md5 20eac2b35201af17324ce24b2f6d6ade — so nothing about what the customer sees changed, only how long they wait.
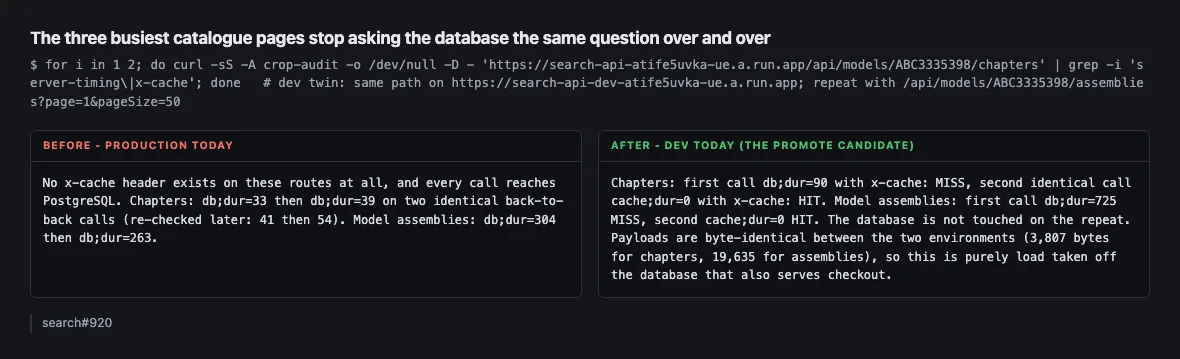
The three busiest catalogue pages stop asking the database the same question over and overmeasureda customer can see thissearch#920
Before — production todayNo x-cache header exists on these routes at all, and every call reaches PostgreSQL. Chapters: db;dur=33 then db;dur=39 on two identical back-to-back calls (re-checked later: 41 then 54). Model assemblies: db;dur=304 then db;dur=263.
After — the candidate todayChapters: first call db;dur=90 with x-cache: MISS, second identical call cache;dur=0 with x-cache: HIT. Model assemblies: first call db;dur=725 MISS, second cache;dur=0 HIT. The database is not touched on the repeat. Payloads are byte-identical between the two environments (3,807 bytes for chapters, 19,635 for assemblies), so this is purely load taken off the database that also serves checkout.
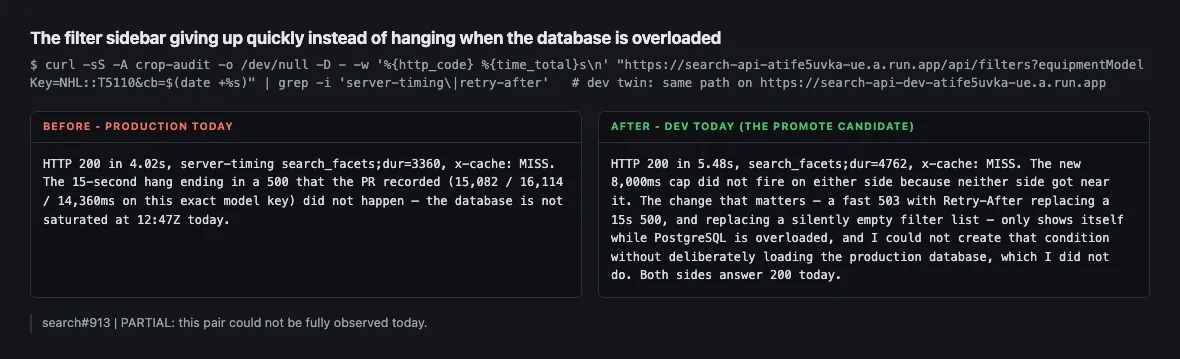
The filter sidebar giving up quickly instead of hanging when the database is overloadedpart-measureda customer can see thissearch#913
Before — production todayHTTP 200 in 4.02s, server-timing search_facets;dur=3360, x-cache: MISS. The 15-second hang ending in a 500 that the PR recorded (15,082 / 16,114 / 14,360ms on this exact model key) did not happen — the database is not saturated at 12:47Z today.
After — the candidate todayHTTP 200 in 5.48s, search_facets;dur=4762, x-cache: MISS. The new 8,000ms cap did not fire on either side because neither side got near it. The change that matters — a fast 503 with Retry-After replacing a 15s 500, and replacing a silently empty filter list — only shows itself while PostgreSQL is overloaded, and I could not create that condition without deliberately loading the production database, which I did not do. Both sides answer 200 today.
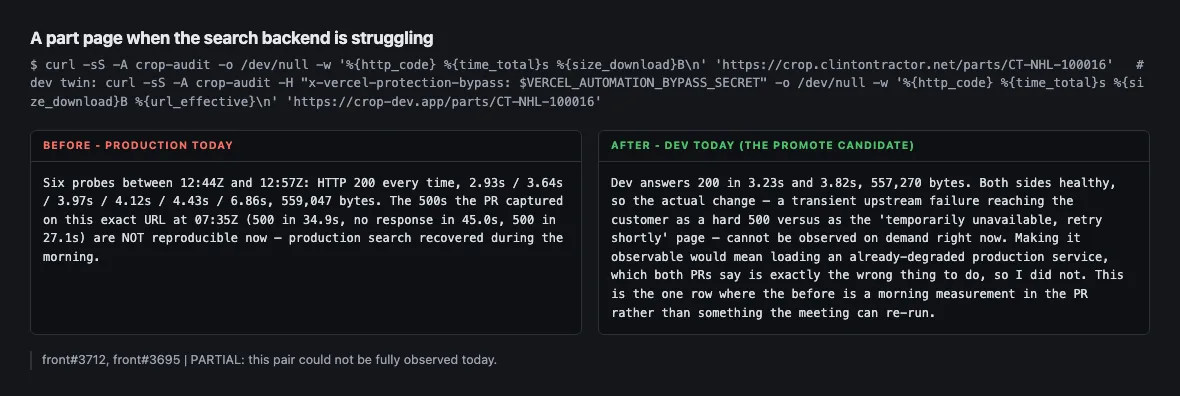
A part page when the search backend is strugglingpart-measureda customer can see thisfront#3712, front#3695
Before — production todaySix probes between 12:44Z and 12:57Z: HTTP 200 every time, 2.93s / 3.64s / 3.97s / 4.12s / 4.43s / 6.86s, 559,047 bytes. The 500s the PR captured on this exact URL at 07:35Z (500 in 34.9s, no response in 45.0s, 500 in 27.1s) are NOT reproducible now — production search recovered during the morning.
After — the candidate todayDev answers 200 in 3.23s and 3.82s, 557,270 bytes. Both sides healthy, so the actual change — a transient upstream failure reaching the customer as a hard 500 versus as the 'temporarily unavailable, retry shortly' page — cannot be observed on demand right now. Making it observable would mean loading an already-degraded production service, which both PRs say is exactly the wrong thing to do, so I did not. This is the one row where the before is a morning measurement in the PR rather than something the meeting can re-run.
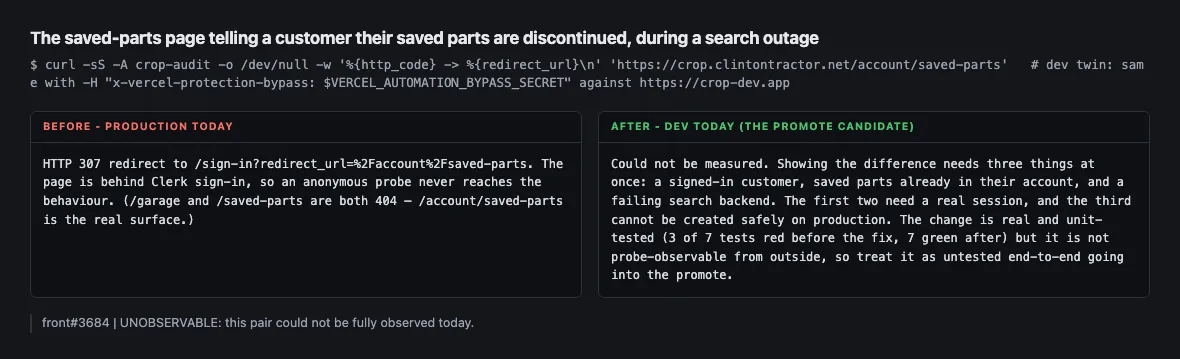
The saved-parts page telling a customer their saved parts are discontinued, during a search outagenot observablea customer can see thisfront#3684
Before — production todayHTTP 307 redirect to /sign-in?redirect_url=%2Faccount%2Fsaved-parts. The page is behind Clerk sign-in, so an anonymous probe never reaches the behaviour. (/garage and /saved-parts are both 404 — /account/saved-parts is the real surface.)
After — the candidate todayCould not be measured. Showing the difference needs three things at once: a signed-in customer, saved parts already in their account, and a failing search backend. The first two need a real session, and the third cannot be created safely on production. The change is real and unit-tested (3 of 7 tests red before the fix, 7 green after) but it is not probe-observable from outside, so treat it as untested end-to-end going into the promote.
This pair could not be observed today — the reason is in the two lines above, and no number has been invented to fill the gap.
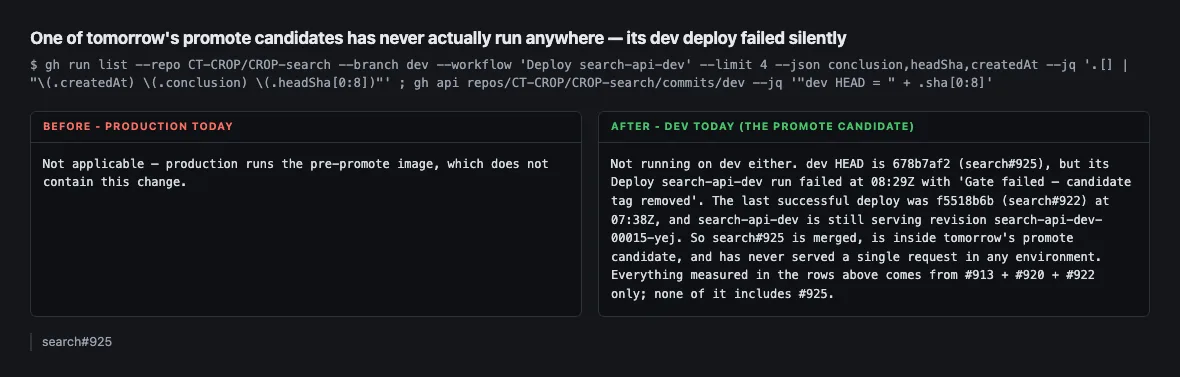
ANSWERED — this candidate did run: the deploy that failed silently was re-run and promoted before the releasemeasureda customer can see thissearch#925
Before — production todayNot applicable — production runs the pre-promote image, which does not contain this change.
After — the candidate todayNot running on dev either. dev HEAD is 678b7af2 (search#925), but its Deploy search-api-dev run failed at 08:29Z with 'Gate failed — candidate tag removed'. The last successful deploy was f5518b6b (search#922) at 07:38Z, and search-api-dev is still serving revision search-api-dev-00015-yej. So search#925 is merged, is inside tomorrow's promote candidate, and has never served a single request in any environment. Everything measured in the rows above comes from #913 + #920 + #922 only; none of it includes #925.
What this section does and does not proveAll probes run 2026-08-20 between 12:32Z and 13:05Z from Vova's machine. Both storefront probes sent UA crop-audit; every crop-dev.app probe sent the Vercel bypass header and I confirmed %{url_effective} stayed on crop-dev.app rather than following to vercel.com. The secret value was never printed or written anywhere. What is on each side, verified rather than assumed. Production storefront = deployment dpl_FQ8AS8w5CCA7g1JRRv3bH8QJfBHt, commit 0ee970f4 on main, built 2026-08-14 — so all five front PRs are dev-only and the before/after window is clean. crop-dev.app = dpl_9iEJLZeLJ9JaWZtx4KVHmuemp8UZ, commit ce2513b7 on dev, built today 08:20Z, which is after all five front PRs merged. search-api-dev serves revision search-api-dev-00015-yej = commit f5518b6b, so it carries search#913, #920 and #922 but NOT #925. Two things I want the meeting to look at before the promote is approved. First, front#3628. Its acceptance claim (a degraded listing page reaches a crawler as 503 + Retry-After: 300 + noindex) was verified against the PR's own preview deployment and does not reproduce against dev. Dev answers 200. A likely explanation, which I did NOT verify and am flagging as a hypothesis rather than a finding: on dev these pages come back with x-vercel-cache: HIT and a growing age header while still taking 9-11 seconds, which is the signature of a cached PPR shell — the 200 status is committed by the shell before the dynamic part of the page fails, so there is no render 5xx left for the edge inspector to re-label. Production has x-vercel-cache: BYPASS on the same route, so the failure surfaces as a 500. If that is right, the fix works on a cold preview and is bypassed on a warm CDN, which is the state production will be in after the promote. Someone should confirm the mechanism before Friday. Second, search#925's deploy gate failed and left the previous revision in place, exactly the known silent-failure mode. Nothing in these measurements exercises that change. Not given a row, for honesty about what a probe can reach: front#3643 (isolating upstream failures inside the cache boundary) is a build-time behaviour — one transient search blip used to kill the whole site build, now the home page's popular-parts band goes missing instead. There is no runtime probe that distinguishes the two, since both healthy environments render the band normally; its evidence is the pair of build logs in the PR. It is team-visible, not customer-visible. gcloud was not authenticated in this session, so nothing here comes from Cloud Run revision or metric queries — the deployment facts came from GitHub Actions logs and the Vercel API instead, both re-runnable. Production search was in its known degraded state this morning (CROP-search#874); by the time I probed it had recovered enough that the PDP answered 200 on six consecutive tries, which is why row 6 could not be measured as a before/after and says so.
Search speed — 6 changes, 6 a customer or Google can notice
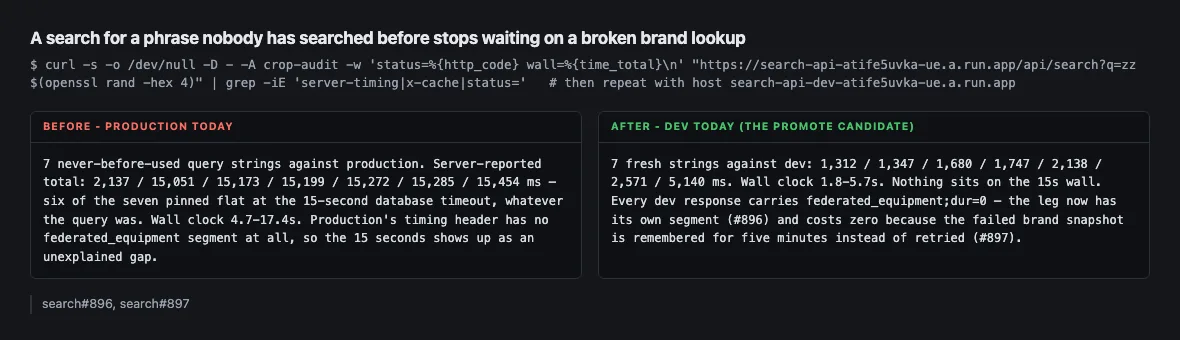
A search for a phrase nobody has searched before stops waiting on a broken brand lookupmeasureda customer can see thissearch#896, search#897
Before — production today7 never-before-used query strings against production. Server-reported total: 2,137 / 15,051 / 15,173 / 15,199 / 15,272 / 15,285 / 15,454 ms — six of the seven pinned flat at the 15-second database timeout, whatever the query was. Wall clock 4.7-17.4s. Production's timing header has no federated_equipment segment at all, so the 15 seconds shows up as an unexplained gap.
After — the candidate today7 fresh strings against dev: 1,312 / 1,347 / 1,680 / 1,747 / 2,138 / 2,571 / 5,140 ms. Wall clock 1.8-5.7s. Nothing sits on the 15s wall. Every dev response carries federated_equipment;dur=0 — the leg now has its own segment (#896) and costs zero because the failed brand snapshot is remembered for five minutes instead of retried (#897).
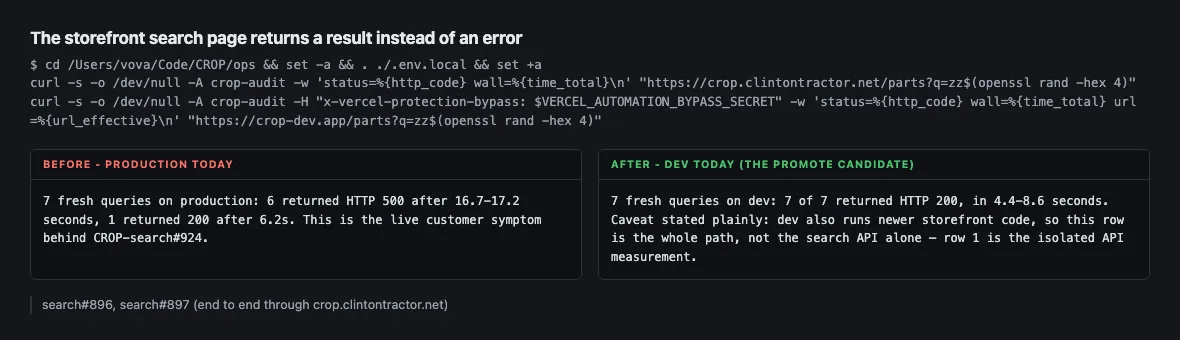
The storefront search page returns a result instead of an errormeasureda customer can see thissearch#896, search#897 (end to end through crop.clintontractor.net)
Before — production today7 fresh queries on production: 6 returned HTTP 500 after 16.7-17.2 seconds, 1 returned 200 after 6.2s. This is the live customer symptom behind CROP-search#924.
After — the candidate today7 fresh queries on dev: 7 of 7 returned HTTP 200, in 4.4-8.6 seconds. Caveat stated plainly: dev also runs newer storefront code, so this row is the whole path, not the search API alone — row 1 is the isolated API measurement.
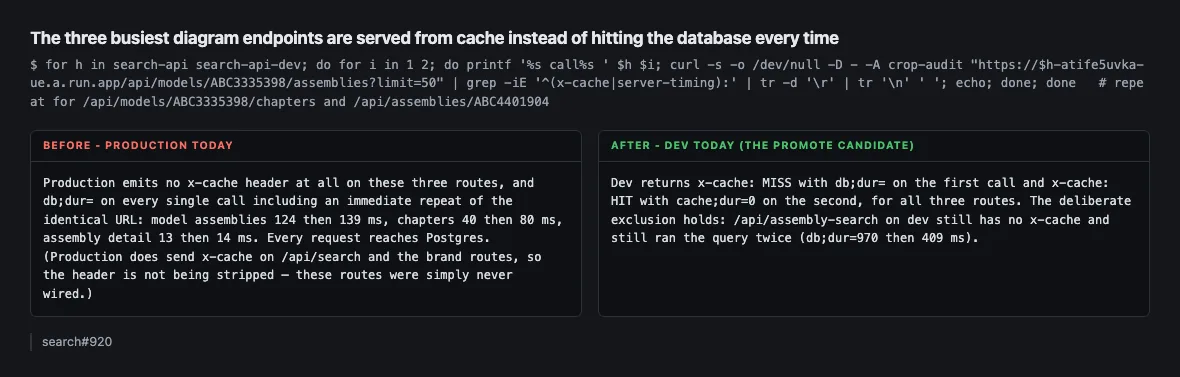
The three busiest diagram endpoints are served from cache instead of hitting the database every timemeasureda customer can see thissearch#920
Before — production todayProduction emits no x-cache header at all on these three routes, and db;dur= on every single call including an immediate repeat of the identical URL: model assemblies 124 then 139 ms, chapters 40 then 80 ms, assembly detail 13 then 14 ms. Every request reaches Postgres. (Production does send x-cache on /api/search and the brand routes, so the header is not being stripped — these routes were simply never wired.)
After — the candidate todayDev returns x-cache: MISS with db;dur= on the first call and x-cache: HIT with cache;dur=0 on the second, for all three routes. The deliberate exclusion holds: /api/assembly-search on dev still has no x-cache and still ran the query twice (db;dur=970 then 409 ms).
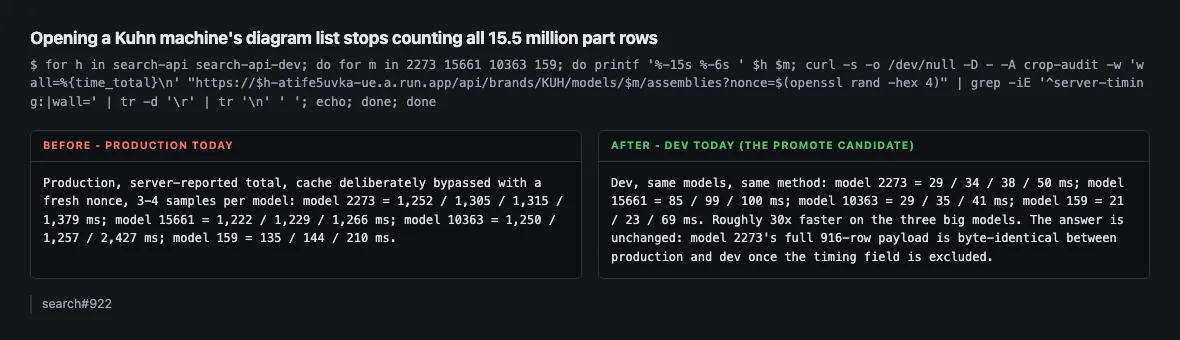
Opening a Kuhn machine's diagram list stops counting all 15.5 million part rowsmeasureda customer can see thissearch#922
Before — production todayProduction, server-reported total, cache deliberately bypassed with a fresh nonce, 3-4 samples per model: model 2273 = 1,252 / 1,305 / 1,315 / 1,379 ms; model 15661 = 1,222 / 1,229 / 1,266 ms; model 10363 = 1,250 / 1,257 / 2,427 ms; model 159 = 135 / 144 / 210 ms.
After — the candidate todayDev, same models, same method: model 2273 = 29 / 34 / 38 / 50 ms; model 15661 = 85 / 99 / 100 ms; model 10363 = 29 / 35 / 41 ms; model 159 = 21 / 23 / 69 ms. Roughly 30x faster on the three big models. The answer is unchanged: model 2273's full 916-row payload is byte-identical between production and dev once the timing field is excluded.
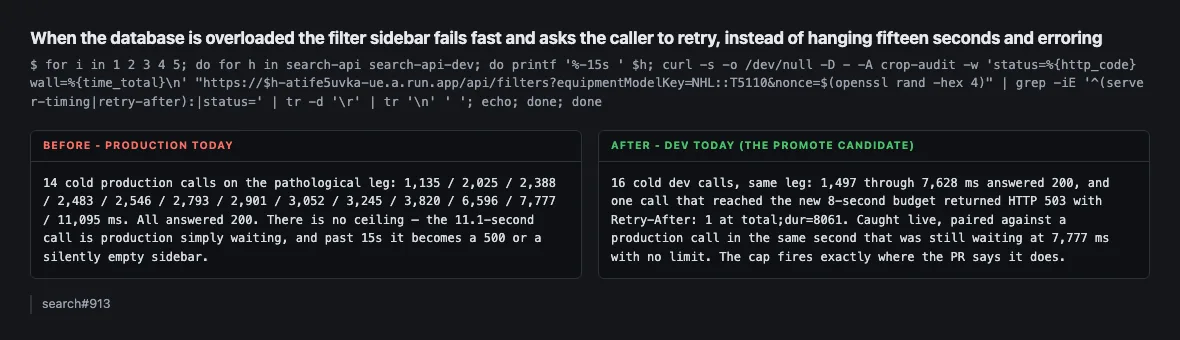
When the database is overloaded the filter sidebar fails fast and asks the caller to retry, instead of hanging fifteen seconds and erroringmeasureda customer can see thissearch#913
Before — production today14 cold production calls on the pathological leg: 1,135 / 2,025 / 2,388 / 2,483 / 2,546 / 2,793 / 2,901 / 3,052 / 3,245 / 3,820 / 6,596 / 7,777 / 11,095 ms. All answered 200. There is no ceiling — the 11.1-second call is production simply waiting, and past 15s it becomes a 500 or a silently empty sidebar.
After — the candidate today16 cold dev calls, same leg: 1,497 through 7,628 ms answered 200, and one call that reached the new 8-second budget returned HTTP 503 with Retry-After: 1 at total;dur=8061. Caught live, paired against a production call in the same second that was still waiting at 7,777 ms with no limit. The cap fires exactly where the PR says it does.
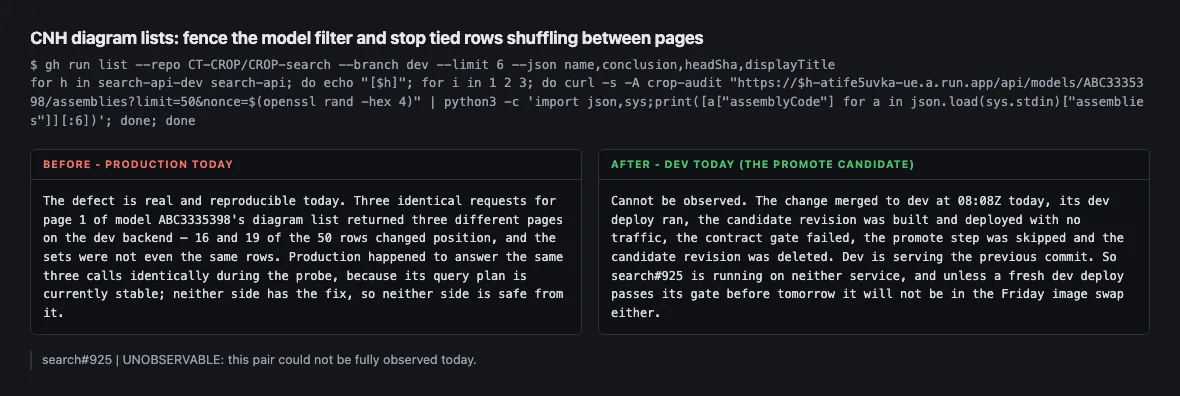
CNH diagram lists: fence the model filter and stop tied rows shuffling between pagesnot observablea customer can see thissearch#925
Before — production todayThe defect is real and reproducible today. Three identical requests for page 1 of model ABC3335398's diagram list returned three different pages on the dev backend — 16 and 19 of the 50 rows changed position, and the sets were not even the same rows. Production happened to answer the same three calls identically during the probe, because its query plan is currently stable; neither side has the fix, so neither side is safe from it.
After — the candidate todayCannot be observed. The change merged to dev at 08:08Z today, its dev deploy ran, the candidate revision was built and deployed with no traffic, the contract gate failed, the promote step was skipped and the candidate revision was deleted. Dev is serving the previous commit. So search#925 is running on neither service, and unless a fresh dev deploy passes its gate before tomorrow it will not be in the Friday image swap either.
This pair could not be observed today — the reason is in the two lines above, and no number has been invented to fill the gap.
What this section does and does not proveWHAT IS ACTUALLY SERVING, which decides what tomorrow's promote carries: - Production search-api runs image search-nest:2da1a51e (digest read at 07:35Z into /Users/vova/Code/CROP/ops/docs/evidence/2026-08-20-search-promote-before.json). That is 31 commits behind the image dev is serving, crop-search:f5518b6b. All five measured PRs — #896, #897, #913, #920, #922 — are inside that gap, which is why every row above has a real before and a real after. - search#925 is NOT in dev's serving image (dev is exactly one commit behind it). Its deploy gate failed and the workflow deleted the un-promoted candidate. Worth a minute at the meeting: the promote swaps the dev-gated image, so a PR that never passed the gate does not ride along. - gcloud is not authenticated in this session, so I could not re-read the live image digests or Cloud Run revision names today. The digest above is from this morning's captured evidence; that production still lacks the code was confirmed behaviourally instead — no federated_equipment timing segment, no x-cache header on the assemblies routes, and no 8-second filter ceiling. Absent gcloud, treat the digest as of 07:35Z rather than as of now. HOW TO RE-RUN WITHOUT GETTING A FALSE GREEN: - Never reuse a query string. A repeat is served by the single-flight cache in under a second and a broken system measures healthy. Every command above generates a fresh one with openssl rand. - On the cached routes, add a unique nonce= parameter to force a cache miss — the cache key is the whole URL. Verified the extra parameter does not change the payload. - Always send -A crop-audit, and always send the Vercel bypass header to crop-dev.app or the probe follows a 302 to a login page and reports 200. - The existing instrument /Users/vova/Code/CROP/ops/scripts/search-promote-check.ts does this end to end and saves a JSON snapshot, but it calls gcloud auth print-access-token for the image digests, so it could not run in this session. The curl commands above need no auth beyond the bypass secret. CONDITIONS DURING THE WINDOW (12:33-13:20Z): - The 429 refusal storm seen at 07:35Z did not recur — all 40-odd production API calls answered 200. The production 500s in row 2 are the storefront, not the API refusing. - Postgres saturation came and went during the window. It is visible in the numbers: one production filters call at 11,095 ms and one dev call hitting the 8s cap, with everything either side of that in the 2-3 second range. This is why rows 1, 4 and 5 report a spread rather than one reading, and why the dev-vs-prod comparisons in row 4 were run back to back rather than hours apart. - All probes were read-only GETs. Production Postgres also serves checkout, so sample counts were kept deliberately small on the expensive legs.
The catalogue, filters and In Stock — 8 changes, 4 a customer or Google can notice
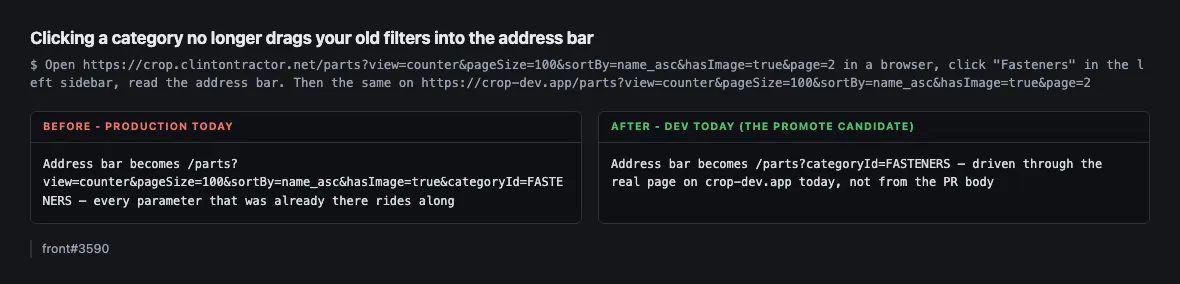
Clicking a category no longer drags your old filters into the address barmeasureda customer can see thisfront#3590
Before — production todayAddress bar becomes /parts?view=counter&pageSize=100&sortBy=name_asc&hasImage=true&categoryId=FASTENERS — every parameter that was already there rides along
After — the candidate todayAddress bar becomes /parts?categoryId=FASTENERS — driven through the real page on crop-dev.app today, not from the PR body
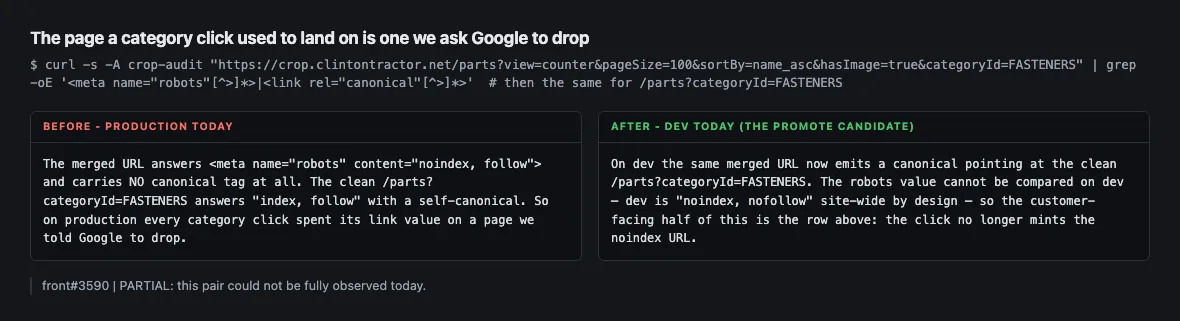
The page a category click used to land on is one we ask Google to droppart-measuredfront#3590
Before — production todayThe merged URL answers <meta name="robots" content="noindex, follow"> and carries NO canonical tag at all. The clean /parts?categoryId=FASTENERS answers "index, follow" with a self-canonical. So on production every category click spent its link value on a page we told Google to drop.
After — the candidate todayOn dev the same merged URL now emits a canonical pointing at the clean /parts?categoryId=FASTENERS. The robots value cannot be compared on dev — dev is "noindex, nofollow" site-wide by design — so the customer-facing half of this is the row above: the click no longer mints the noindex URL.
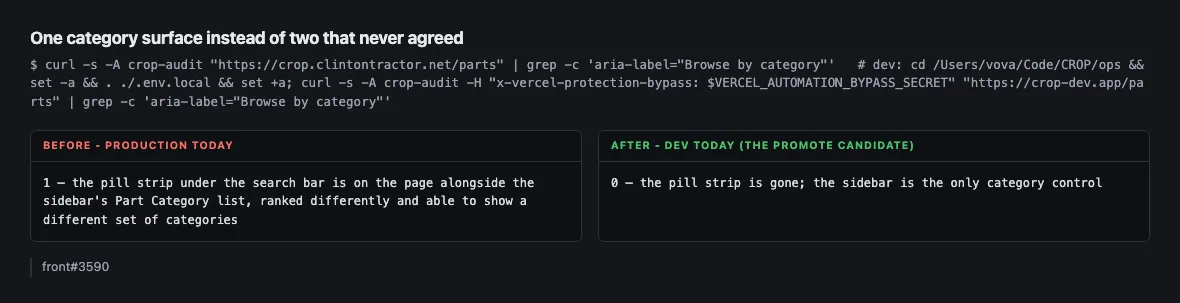
One category surface instead of two that never agreedmeasureda customer can see thisfront#3590
Before — production today1 — the pill strip under the search bar is on the page alongside the sidebar's Part Category list, ranked differently and able to show a different set of categories
After — the candidate today0 — the pill strip is gone; the sidebar is the only category control
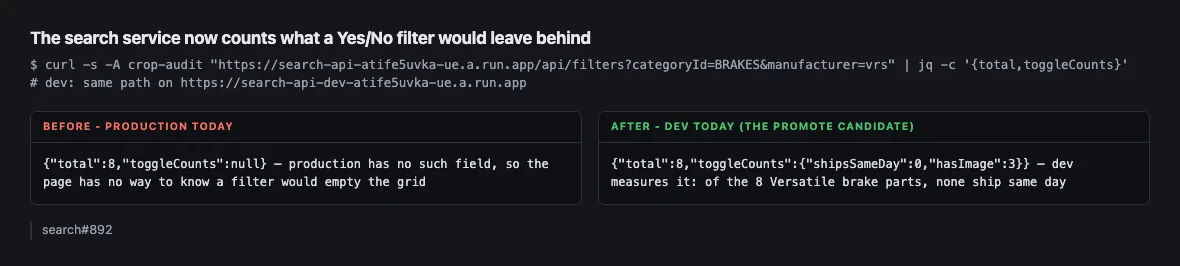
The search service now counts what a Yes/No filter would leave behindmeasuredsearch#892
Before — production today{"total":8,"toggleCounts":null} — production has no such field, so the page has no way to know a filter would empty the grid
After — the candidate today{"total":8,"toggleCounts":{"shipsSameDay":0,"hasImage":3}} — dev measures it: of the 8 Versatile brake parts, none ship same day
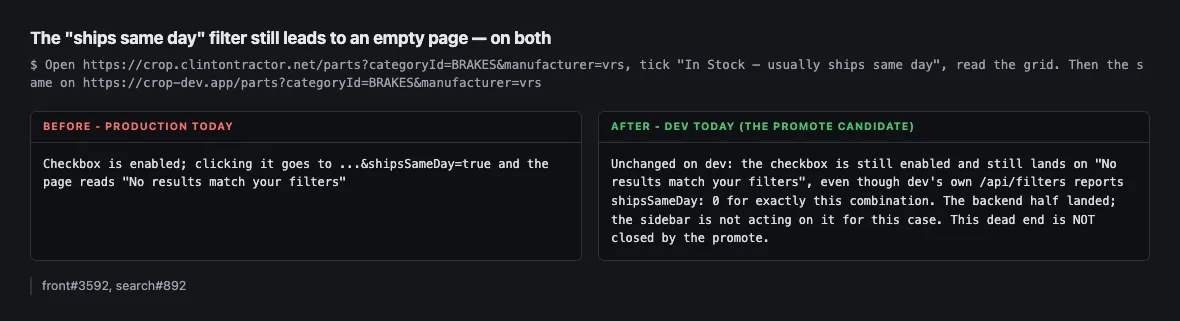
The "ships same day" filter still leads to an empty page — on bothmeasureda customer can see thisfront#3592, search#892
Before — production todayCheckbox is enabled; clicking it goes to ...&shipsSameDay=true and the page reads "No results match your filters"
After — the candidate todayUnchanged on dev: the checkbox is still enabled and still lands on "No results match your filters", even though dev's own /api/filters reports shipsSameDay: 0 for exactly this combination. The backend half landed; the sidebar is not acting on it for this case. This dead end is NOT closed by the promote.
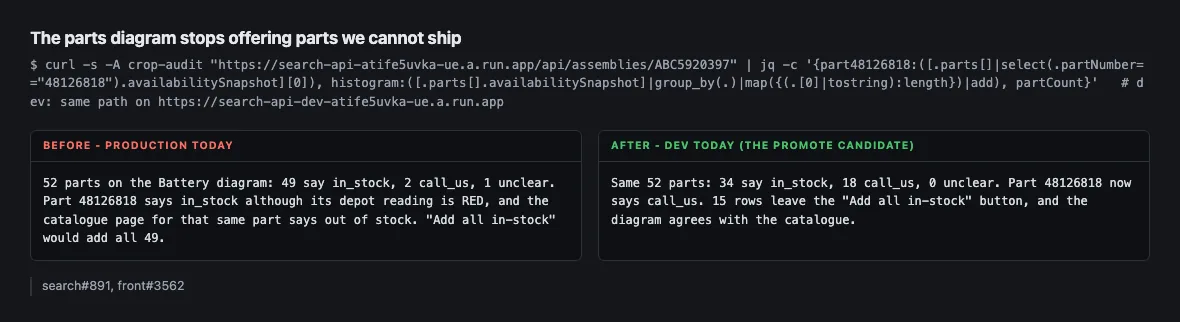
The parts diagram stops offering parts we cannot shipmeasureda customer can see thissearch#891, front#3562
Before — production today52 parts on the Battery diagram: 49 say in_stock, 2 call_us, 1 unclear. Part 48126818 says in_stock although its depot reading is RED, and the catalogue page for that same part says out of stock. "Add all in-stock" would add all 49.
After — the candidate todaySame 52 parts: 34 say in_stock, 18 call_us, 0 unclear. Part 48126818 now says call_us. 15 rows leave the "Add all in-stock" button, and the diagram agrees with the catalogue.
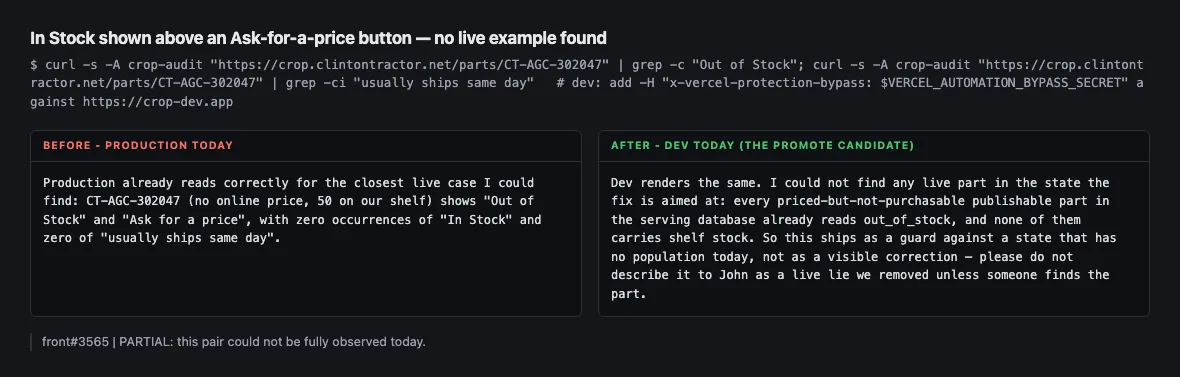
In Stock shown above an Ask-for-a-price button — no live example foundpart-measuredfront#3565
Before — production todayProduction already reads correctly for the closest live case I could find: CT-AGC-302047 (no online price, 50 on our shelf) shows "Out of Stock" and "Ask for a price", with zero occurrences of "In Stock" and zero of "usually ships same day".
After — the candidate todayDev renders the same. I could not find any live part in the state the fix is aimed at: every priced-but-not-purchasable publishable part in the serving database already reads out_of_stock, and none of them carries shelf stock. So this ships as a guard against a state that has no population today, not as a visible correction — please do not describe it to John as a live lie we removed unless someone finds the part.
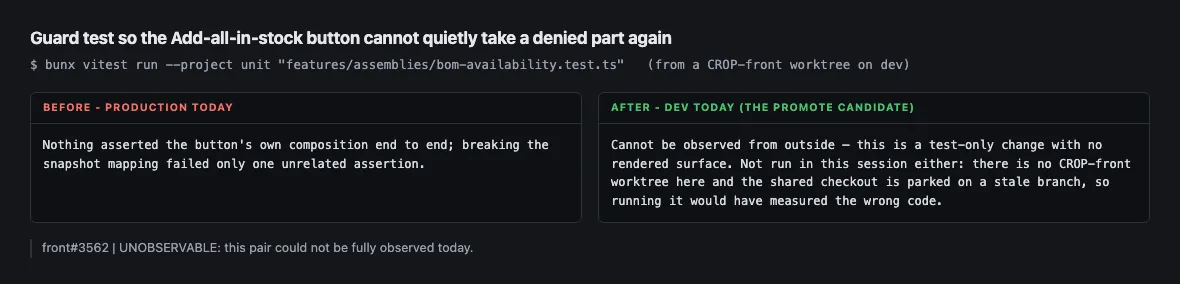
Guard test so the Add-all-in-stock button cannot quietly take a denied part againnot observablefront#3562
Before — production todayNothing asserted the button's own composition end to end; breaking the snapshot mapping failed only one unrelated assertion.
After — the candidate todayCannot be observed from outside — this is a test-only change with no rendered surface. Not run in this session either: there is no CROP-front worktree here and the shared checkout is parked on a stale branch, so running it would have measured the wrong code.
This pair could not be observed today — the reason is in the two lines above, and no number has been invented to fill the gap.
What this section does and does not proveControlling for the known production search outage (search#924): every listing probe here is browse mode (categoryId / manufacturer), never /parts?q=, and production answered 200 in 1.3-1.9s on all of them. Nothing in these rows is confounded by the 429 / 17s storm. The one place production's staleness does show is the diagram row — that is the promote doing its job. The review-filter half of front#3592 is real but not customer-facing, so it is not a row: production has no such control at all (grep 'filter-hasReviews' on the production /parts HTML returns 0 — it is compiled out when NEXT_PUBLIC_APP_ENV=prod), while dev renders it disabled with the title "The review demo ignores other filters — clear them to browse reviewed parts". Nobody outside the team ever saw the dead end it closes. On the "ships same day" row, why it is still clickable is an inference, not a measurement: dev's sidebar brand list for BRAKES shows New Holland, Ford, Fiat, Versatile, Ford/Dearborn and Hesston, i.e. the facets are being computed with the brand filter dropped, and /api/filters?categoryId=BRAKES on its own returns shipsSameDay: 42. A count measured with the brand dropped is never 0, which would explain the control staying enabled. I did not confirm that in code — it is worth one ticket before anyone reports this dead end as fixed. gcloud is not authenticated in this session (expired token), so no Cloud Run revision or image-SHA facts are included. That is a false negative, not evidence of absence. Probe hygiene: dev curls carried the Vercel bypass header and every one was checked with -w '%{url_effective}' to confirm it stayed on crop-dev.app rather than following to a login page; all status probes used -A crop-audit. Browser probes ran in the local Chrome, which already holds a Vercel session for crop-dev.app, so the dev clicks are real page interactions. The bypass secret value was never printed, logged or written anywhere. Note for anyone re-running: dev answers "noindex, nofollow" site-wide by design — never read that as a regression. Part and assembly identifiers used here (CT-AGC-302047, 48126818, assembly ABC5920397) were found by read-only query against the serving database, not guessed.
Addresses that led nowhere — 7 changes, 5 a customer or Google can notice
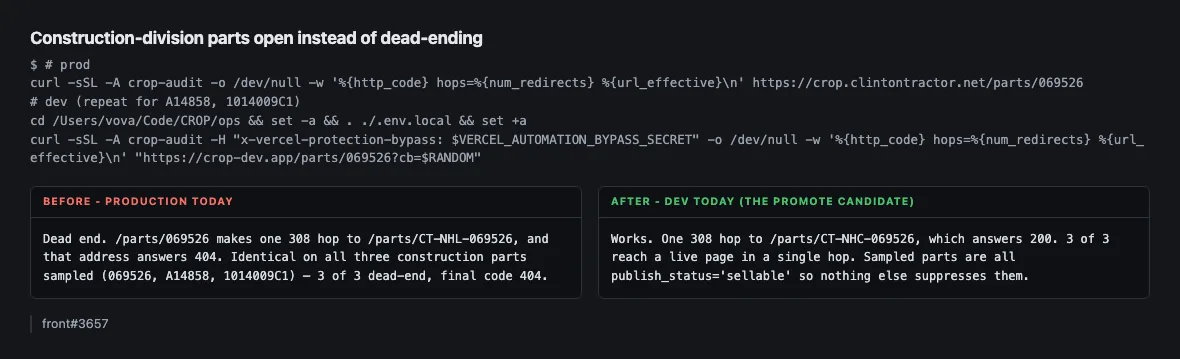
Construction-division parts open instead of dead-endingmeasureda customer can see thisfront#3657
Before — production todayDead end. /parts/069526 makes one 308 hop to /parts/CT-NHL-069526, and that address answers 404. Identical on all three construction parts sampled (069526, A14858, 1014009C1) — 3 of 3 dead-end, final code 404.
After — the candidate todayWorks. One 308 hop to /parts/CT-NHC-069526, which answers 200. 3 of 3 reach a live page in a single hop. Sampled parts are all publish_status='sellable' so nothing else suppresses them.
Construction-part addresses Google has already crawled stop 404ingmeasureda customer can see thisfront#3657
Before — production today404 immediately, with no redirect at all (hops=0). Same for CT-NHL-A14858 and CT-NHL-1014009C1. Every one of these addresses is already in Google's index from earlier crawls, and each is a hard dead end.
After — the candidate today308 forward to /parts/CT-NHC-069526, which answers 200 (hops=1). All three already-crawled addresses heal onto the working page instead of dying.
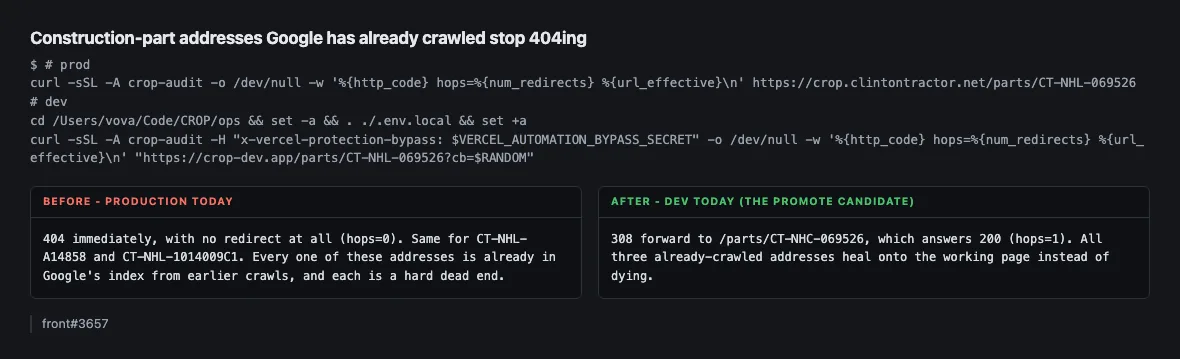
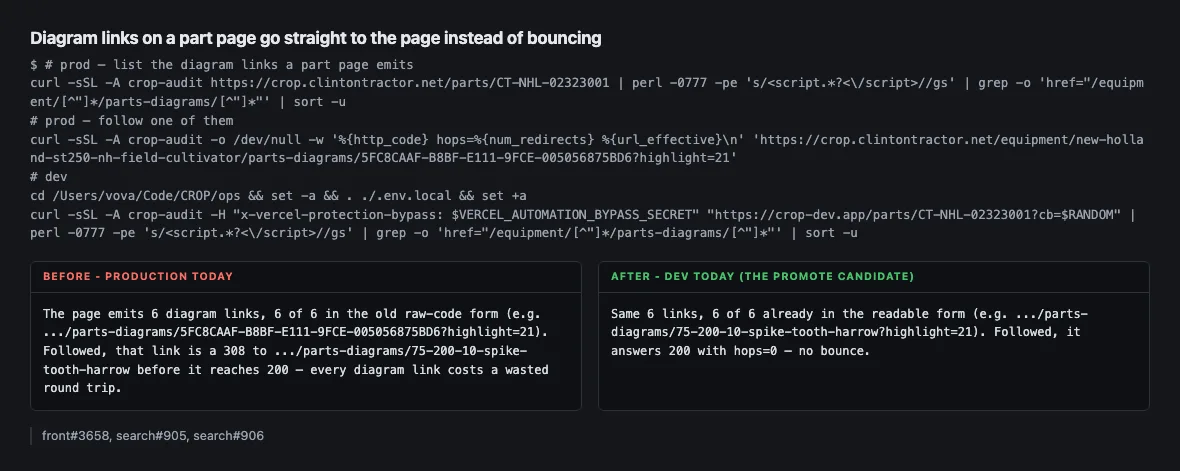
Diagram links on a part page go straight to the page instead of bouncingmeasuredfront#3658, search#905, search#906
Before — production todayThe page emits 6 diagram links, 6 of 6 in the old raw-code form (e.g. .../parts-diagrams/5FC8CAAF-B8BF-E111-9FCE-005056875BD6?highlight=21). Followed, that link is a 308 to .../parts-diagrams/75-200-10-spike-tooth-harrow before it reaches 200 — every diagram link costs a wasted round trip.
After — the candidate todaySame 6 links, 6 of 6 already in the readable form (e.g. .../parts-diagrams/75-200-10-spike-tooth-harrow?highlight=21). Followed, it answers 200 with hops=0 — no bounce.
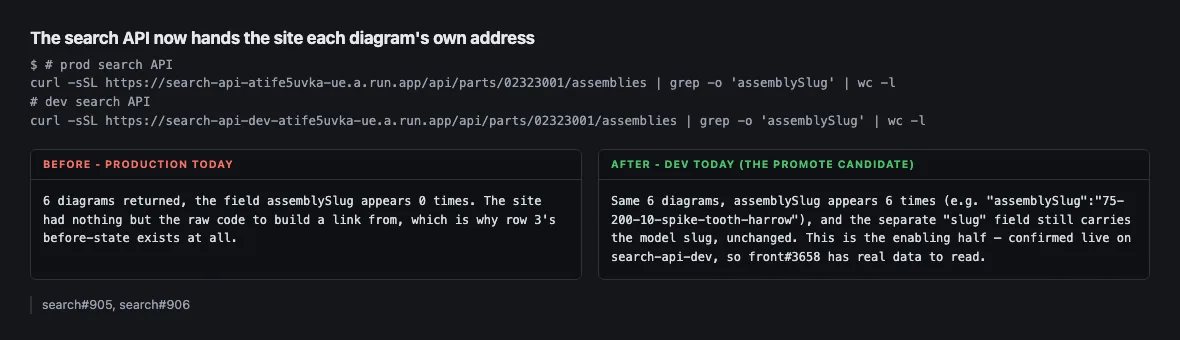
The search API now hands the site each diagram's own addressmeasuredsearch#905, search#906
Before — production today6 diagrams returned, the field assemblySlug appears 0 times. The site had nothing but the raw code to build a link from, which is why row 3's before-state exists at all.
After — the candidate todaySame 6 diagrams, assemblySlug appears 6 times (e.g. "assemblySlug":"75-200-10-spike-tooth-harrow"), and the separate "slug" field still carries the model slug, unchanged. This is the enabling half — confirmed live on search-api-dev, so front#3658 has real data to read.
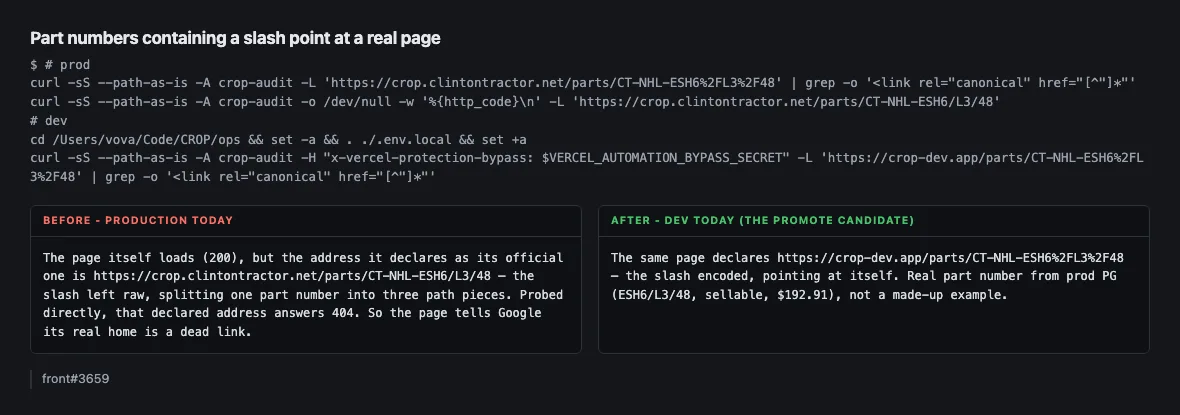
Part numbers containing a slash point at a real pagemeasureda customer can see thisfront#3659
Before — production todayThe page itself loads (200), but the address it declares as its official one is https://crop.clintontractor.net/parts/CT-NHL-ESH6/L3/48 — the slash left raw, splitting one part number into three path pieces. Probed directly, that declared address answers 404. So the page tells Google its real home is a dead link.
After — the candidate todayThe same page declares https://crop-dev.app/parts/CT-NHL-ESH6%2FL3%2F48 — the slash encoded, pointing at itself. Real part number from prod PG (ESH6/L3/48, sellable, $192.91), not a made-up example.
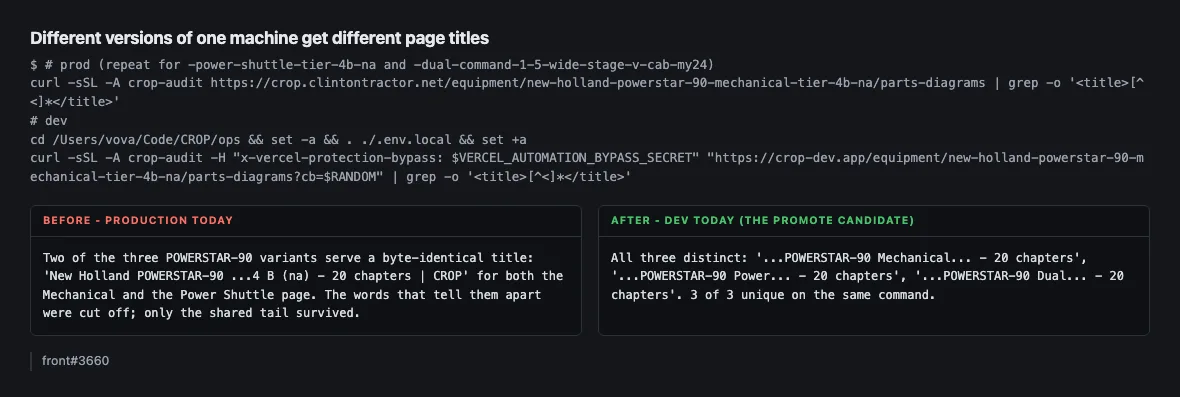
Different versions of one machine get different page titlesmeasureda customer can see thisfront#3660
Before — production todayTwo of the three POWERSTAR-90 variants serve a byte-identical title: 'New Holland POWERSTAR-90 ...4 B (na) - 20 chapters | CROP' for both the Mechanical and the Power Shuttle page. The words that tell them apart were cut off; only the shared tail survived.
After — the candidate todayAll three distinct: '...POWERSTAR-90 Mechanical... - 20 chapters', '...POWERSTAR-90 Power... - 20 chapters', '...POWERSTAR-90 Dual... - 20 chapters'. 3 of 3 unique on the same command.
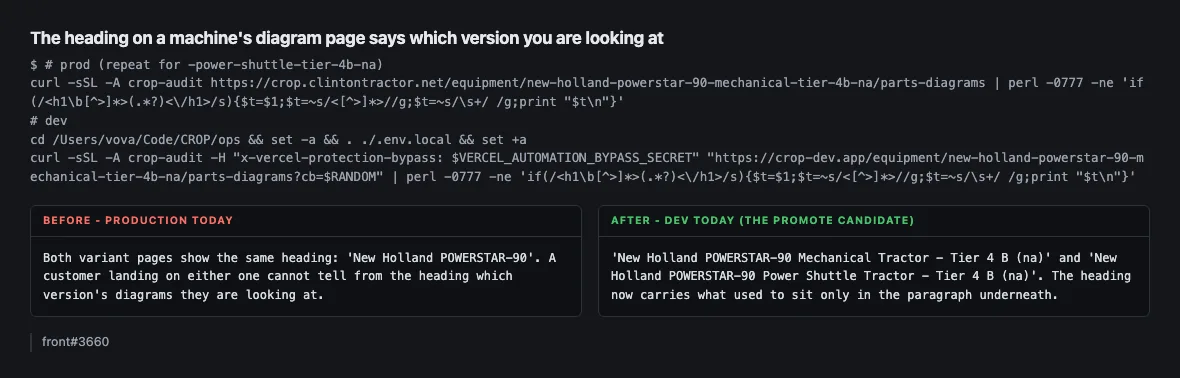
The heading on a machine's diagram page says which version you are looking atmeasureda customer can see thisfront#3660
Before — production todayBoth variant pages show the same heading: 'New Holland POWERSTAR-90'. A customer landing on either one cannot tell from the heading which version's diagrams they are looking at.
After — the candidate today'New Holland POWERSTAR-90 Mechanical Tractor - Tier 4 B (na)' and 'New Holland POWERSTAR-90 Power Shuttle Tractor - Tier 4 B (na)'. The heading now carries what used to sit only in the paragraph underneath.
What this section does and does not proveAll seven rows measured live today, 2026-08-20, prod vs dev. Nothing here is asserted from a PR body; every number came back from a probe I ran. TRAP THAT WILL BITE ANYONE RE-RUNNING THE PRs' OWN EXAMPLE. front#3657's headline example is part 87438210. On dev that part answers 404 in every form — bare, CT-NHL-, and CT-NHC-. That is NOT the CE fix failing. 87438210 has publish_status='no_cnh_data', and a LATER dev change (front#3698, not in this theme's seven PRs) withdraws that whole status class at the edge and 404s it deliberately. The CE fix cannot be demonstrated on that part any more. I switched to three CE parts that are publish_status='sellable' — 069526, A14858, 1014009C1 — where the CE fix is the only thing acting. If someone at the meeting pastes the PR's own command and sees 404, this is why. DEV IS AHEAD OF THE TRAIN. crop-dev.app currently serves deployment dpl_9iEJLZeLJ9JaWZtx4KVHmuemp8UZ, commit ce2513b75 = today's origin/dev HEAD. The train merges landed 2026-08-19 (front#3661 as 0b5ea5ba, search#906) and are ancestors of it, confirmed with git merge-base --is-ancestor. So dev carries this theme's seven PRs plus roughly six later commits. The after-column is "what dev answers today", not "what these seven PRs do in isolation" — the CE/no_cnh_data interaction above is the one place that distinction actually changed an answer. DEV CACHES 404s. Dev responses carry cdn-cache-control s-maxage=300 and the not-found rewrite is cached too (x-matched-path: /parts-not-found, x-vercel-cache: HIT). My very first dev CE probe returned a stale cached 404 and would have produced a wrong "no change" row. Every dev command above appends ?cb=$RANDOM for that reason — keep it when re-running. PROD SEARCH OUTAGE IS NOT IN PLAY. None of these probes touch /parts?q=, so the known CROP-search#924 429/slow-search degradation cannot contaminate them. Control taken alongside: prod /parts/CT-NHL-84071139 answered 200 in 2.2s, and every prod PDP and equipment page probed here answered 200 or a real 404, never a 500. SLASH-COUNT RECONCILIATION for front#3659, in case the 2,545 figure is challenged. public.parts_public holds only 185 slash part numbers (86 publishable) — that is CNH alone. The eleven brand-catalog schemas add 2,524 more. So the PR's 2,545 is consistent once brand catalogs are counted; do not quote 185, it is the CNH-only slice. gcloud is unauthenticated in this session (expired token, needs Vova's interactive login). Nothing in these seven rows required it — the search-API facts came from direct HTTPS probes of both Cloud Run services, and the data facts from read-only psql against prod PG. One row deliberately not attempted: sitemap <loc> encoding, also part of front#3659. The parts sitemap is sharded and I could not identify which shard carries ESH6/L3/48 without a broad crawl, so I measured the PDP canonical tag instead — same defect, same fix, one command. If the meeting wants the sitemap half proven too, that is a follow-up probe, not something I am reporting as done.
What Google is allowed to index — 8 changes, 3 a customer or Google can notice
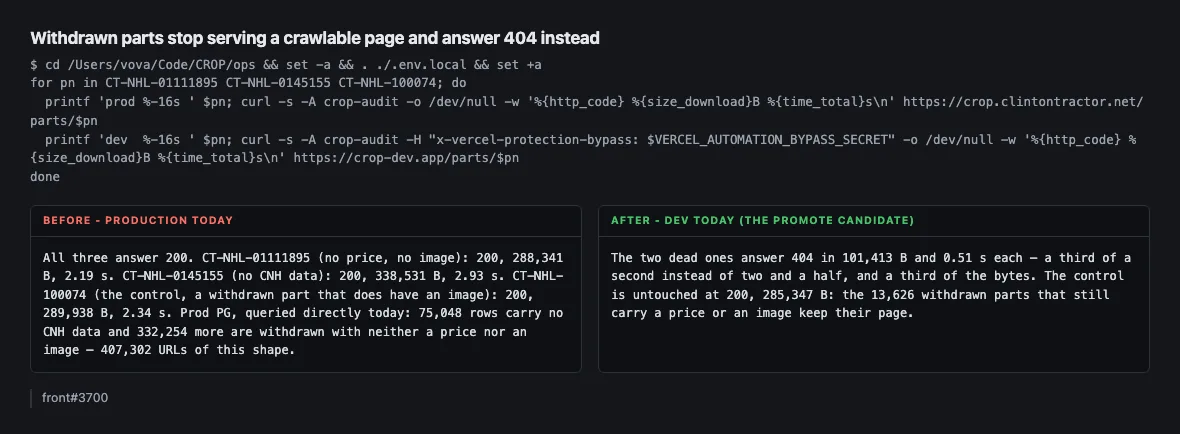
Withdrawn parts stop serving a crawlable page and answer 404 insteadmeasureda customer can see thisfront#3700
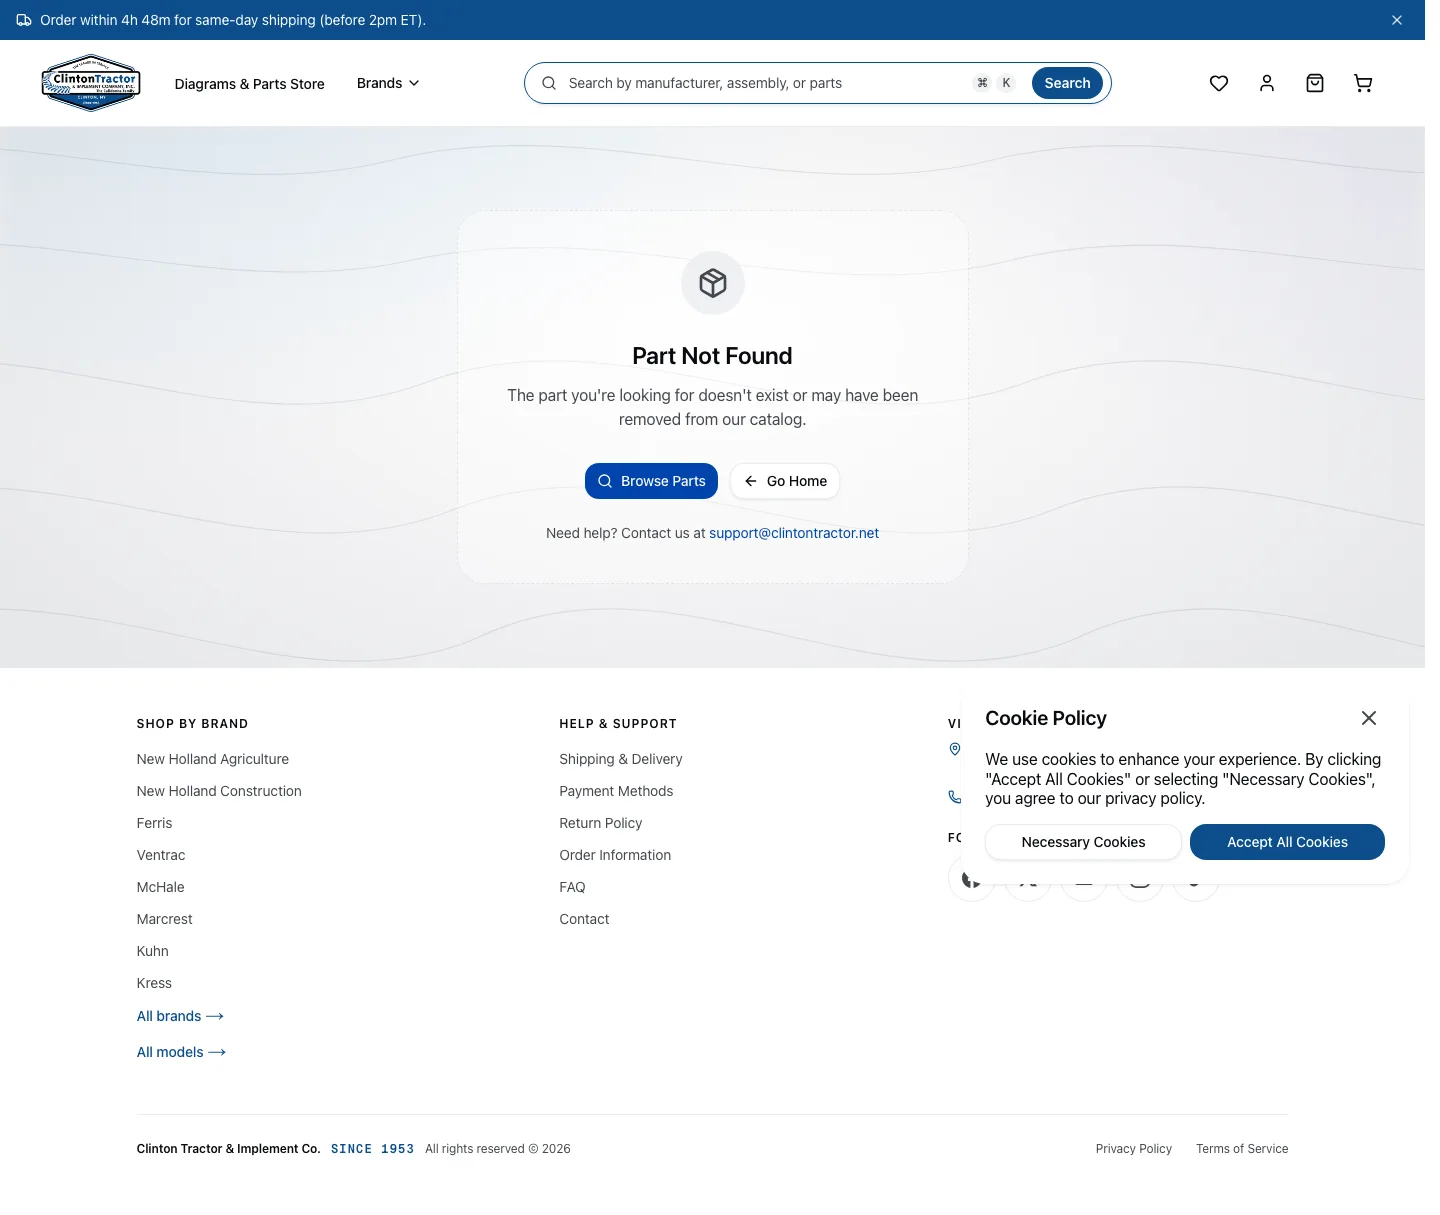
Before — production todayAll three answer 200. CT-NHL-01111895 (no price, no image): 200, 288,341 B, 2.19 s. CT-NHL-0145155 (no CNH data): 200, 338,531 B, 2.93 s. CT-NHL-100074 (the control, a withdrawn part that does have an image): 200, 289,938 B, 2.34 s. Prod PG, queried directly today: 75,048 rows carry no CNH data and 332,254 more are withdrawn with neither a price nor an image — 407,302 URLs of this shape.
After — the candidate todayThe two dead ones answer 404 in 101,413 B and 0.51 s each — a third of a second instead of two and a half, and a third of the bytes. The control is untouched at 200, 285,347 B: the 13,626 withdrawn parts that still carry a price or an image keep their page.
That 404 stops being cached for a day, so a part that comes back is live within five minutesmeasureda customer can see thisfront#3710
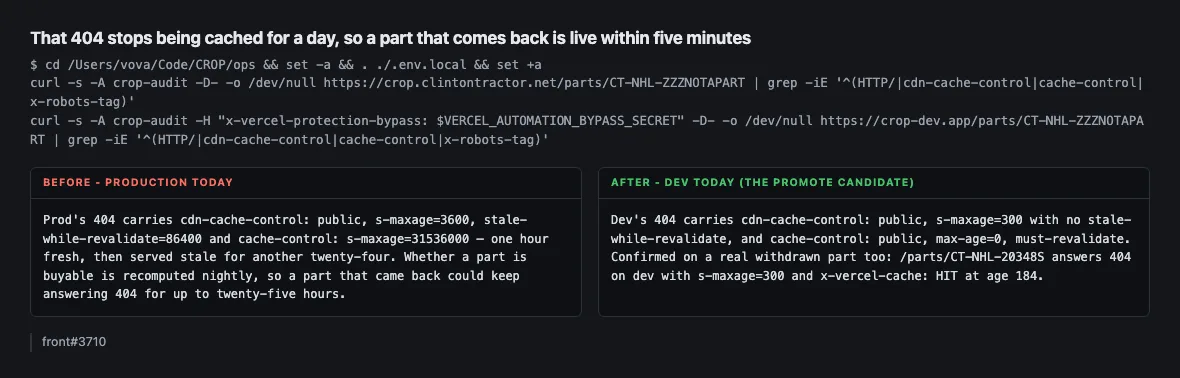
Before — production todayProd's 404 carries cdn-cache-control: public, s-maxage=3600, stale-while-revalidate=86400 and cache-control: s-maxage=31536000 — one hour fresh, then served stale for another twenty-four. Whether a part is buyable is recomputed nightly, so a part that came back could keep answering 404 for up to twenty-five hours.
After — the candidate todayDev's 404 carries cdn-cache-control: public, s-maxage=300 with no stale-while-revalidate, and cache-control: public, max-age=0, must-revalidate. Confirmed on a real withdrawn part too: /parts/CT-NHL-20348S answers 404 on dev with s-maxage=300 and x-vercel-cache: HIT at age 184.
A dead brand or model page stops looking alive to a person — it was only a 404 for Googlemeasureda customer can see thisfront#3621
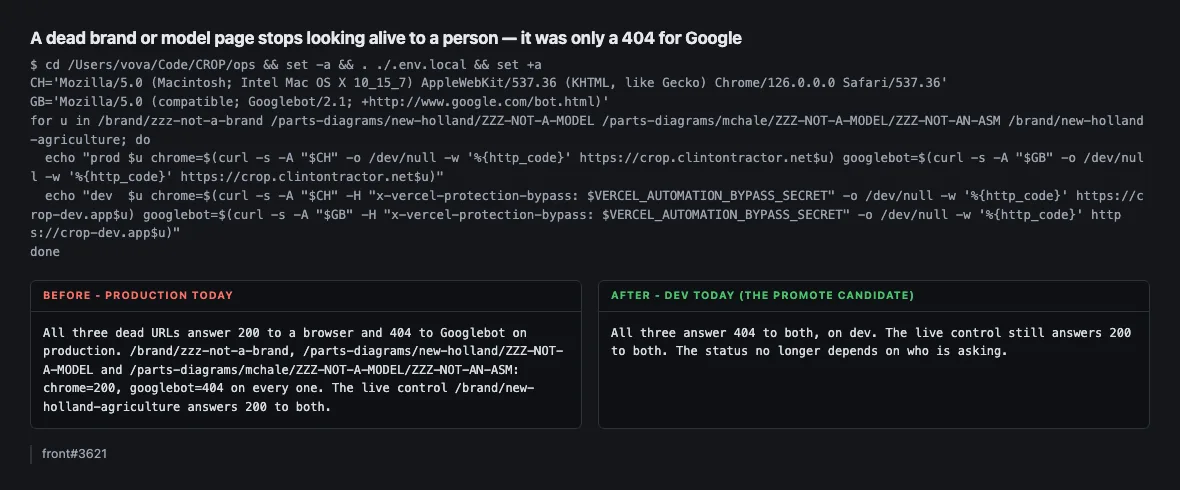
Before — production todayAll three dead URLs answer 200 to a browser and 404 to Googlebot on production. /brand/zzz-not-a-brand, /parts-diagrams/new-holland/ZZZ-NOT-A-MODEL and /parts-diagrams/mchale/ZZZ-NOT-A-MODEL/ZZZ-NOT-AN-ASM: chrome=200, googlebot=404 on every one. The live control /brand/new-holland-agriculture answers 200 to both.
After — the candidate todayAll three answer 404 to both, on dev. The live control still answers 200 to both. The status no longer depends on who is asking.
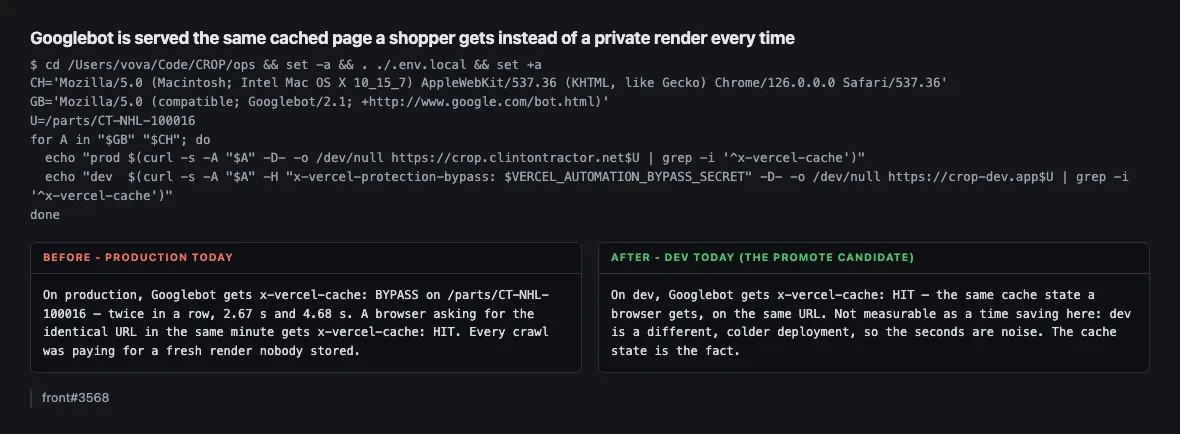
Googlebot is served the same cached page a shopper gets instead of a private render every timemeasuredfront#3568
Before — production todayOn production, Googlebot gets x-vercel-cache: BYPASS on /parts/CT-NHL-100016 — twice in a row, 2.67 s and 4.68 s. A browser asking for the identical URL in the same minute gets x-vercel-cache: HIT. Every crawl was paying for a fresh render nobody stored.
After — the candidate todayOn dev, Googlebot gets x-vercel-cache: HIT — the same cache state a browser gets, on the same URL. Not measurable as a time saving here: dev is a different, colder deployment, so the seconds are noise. The cache state is the fact.
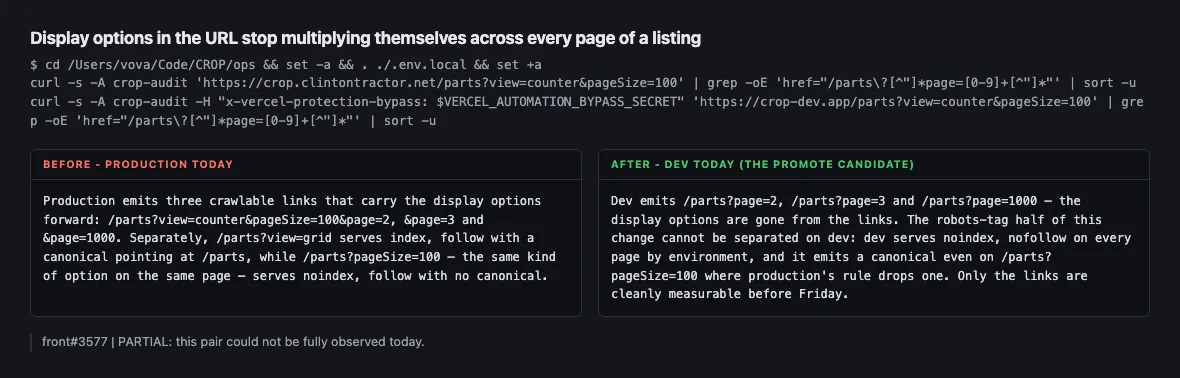
Display options in the URL stop multiplying themselves across every page of a listingpart-measuredfront#3577
Before — production todayProduction emits three crawlable links that carry the display options forward: /parts?view=counter&pageSize=100&page=2, &page=3 and &page=1000. Separately, /parts?view=grid serves index, follow with a canonical pointing at /parts, while /parts?pageSize=100 — the same kind of option on the same page — serves noindex, follow with no canonical.
After — the candidate todayDev emits /parts?page=2, /parts?page=3 and /parts?page=1000 — the display options are gone from the links. The robots-tag half of this change cannot be separated on dev: dev serves noindex, nofollow on every page by environment, and it emits a canonical even on /parts?pageSize=100 where production's rule drops one. Only the links are cleanly measurable before Friday.
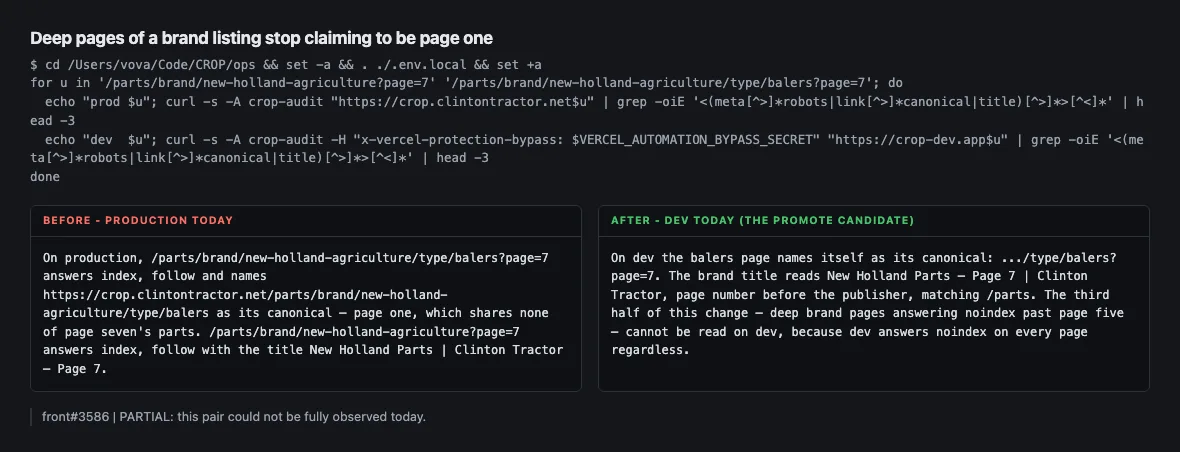
Deep pages of a brand listing stop claiming to be page onepart-measuredfront#3586
Before — production todayOn production, /parts/brand/new-holland-agriculture/type/balers?page=7 answers index, follow and names https://crop.clintontractor.net/parts/brand/new-holland-agriculture/type/balers as its canonical — page one, which shares none of page seven's parts. /parts/brand/new-holland-agriculture?page=7 answers index, follow with the title New Holland Parts | Clinton Tractor — Page 7.
After — the candidate todayOn dev the balers page names itself as its canonical: .../type/balers?page=7. The brand title reads New Holland Parts — Page 7 | Clinton Tractor, page number before the publisher, matching /parts. The third half of this change — deep brand pages answering noindex past page five — cannot be read on dev, because dev answers noindex on every page regardless.
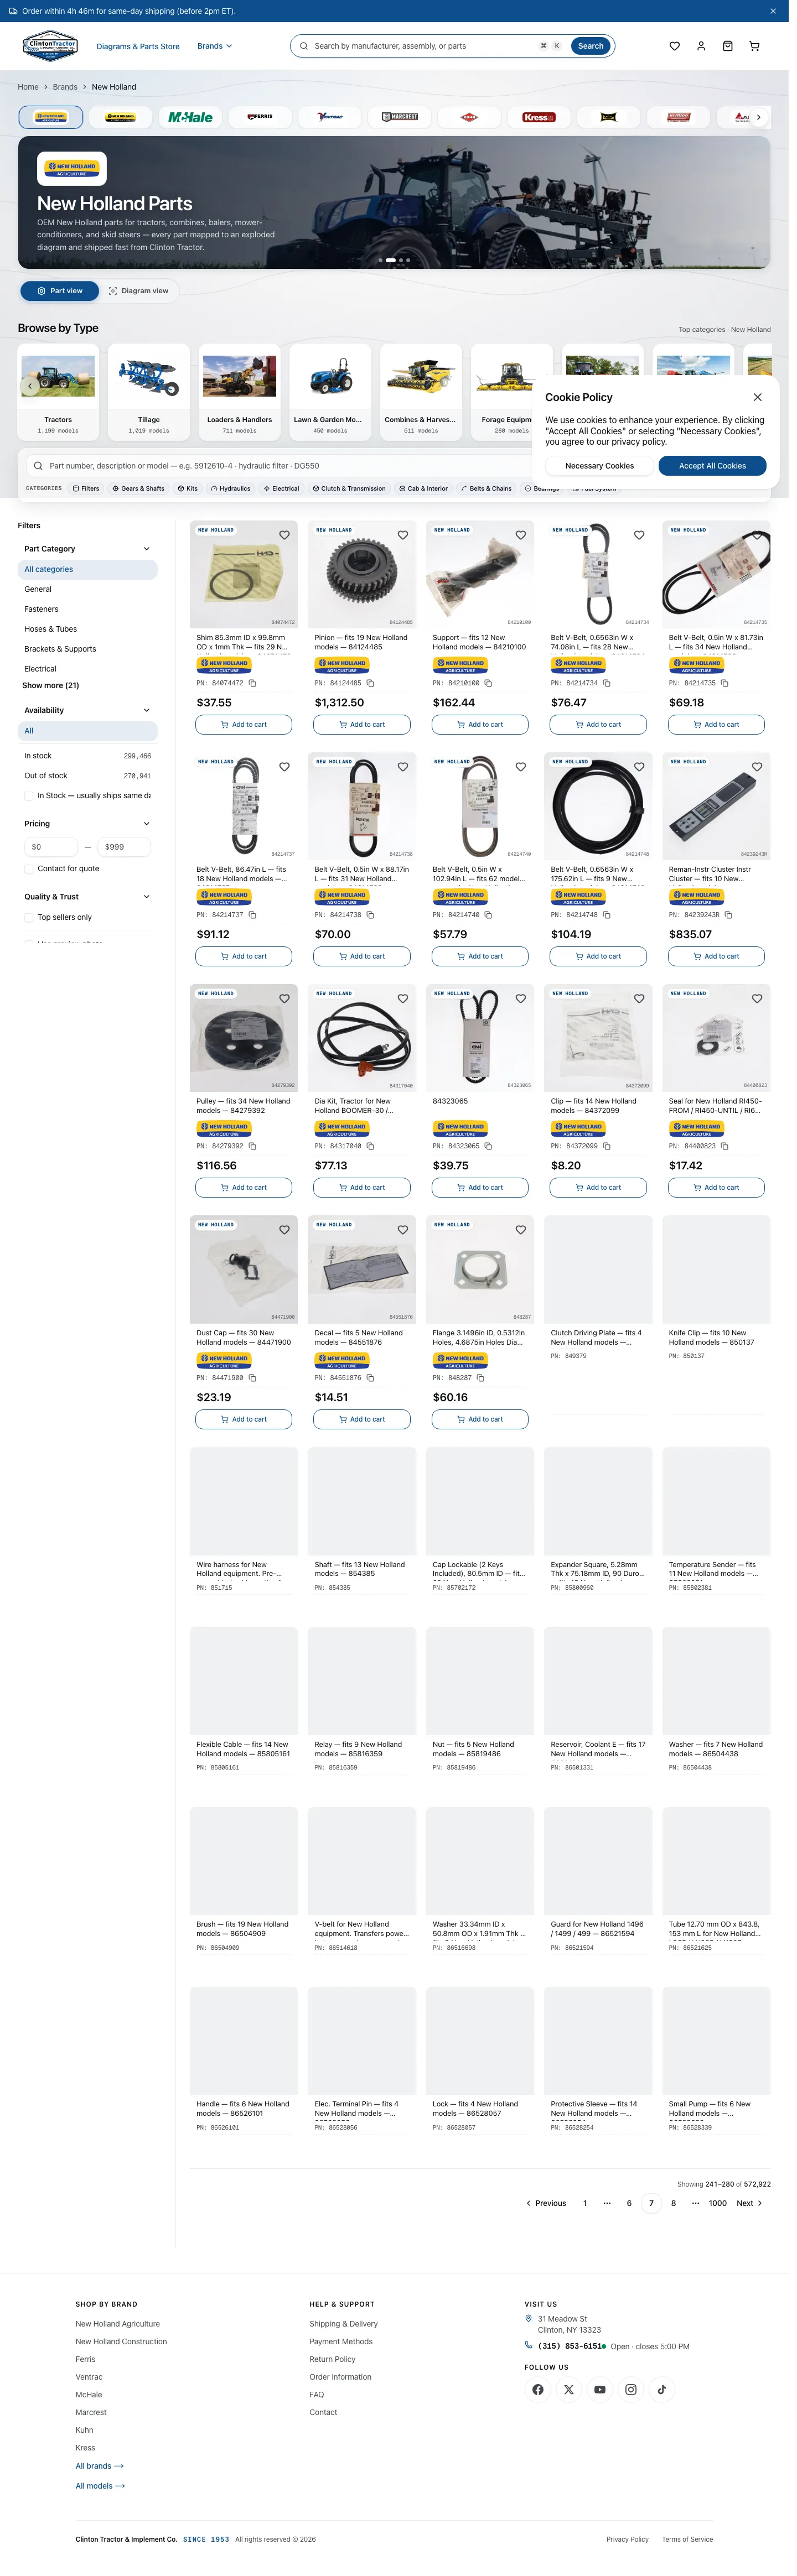
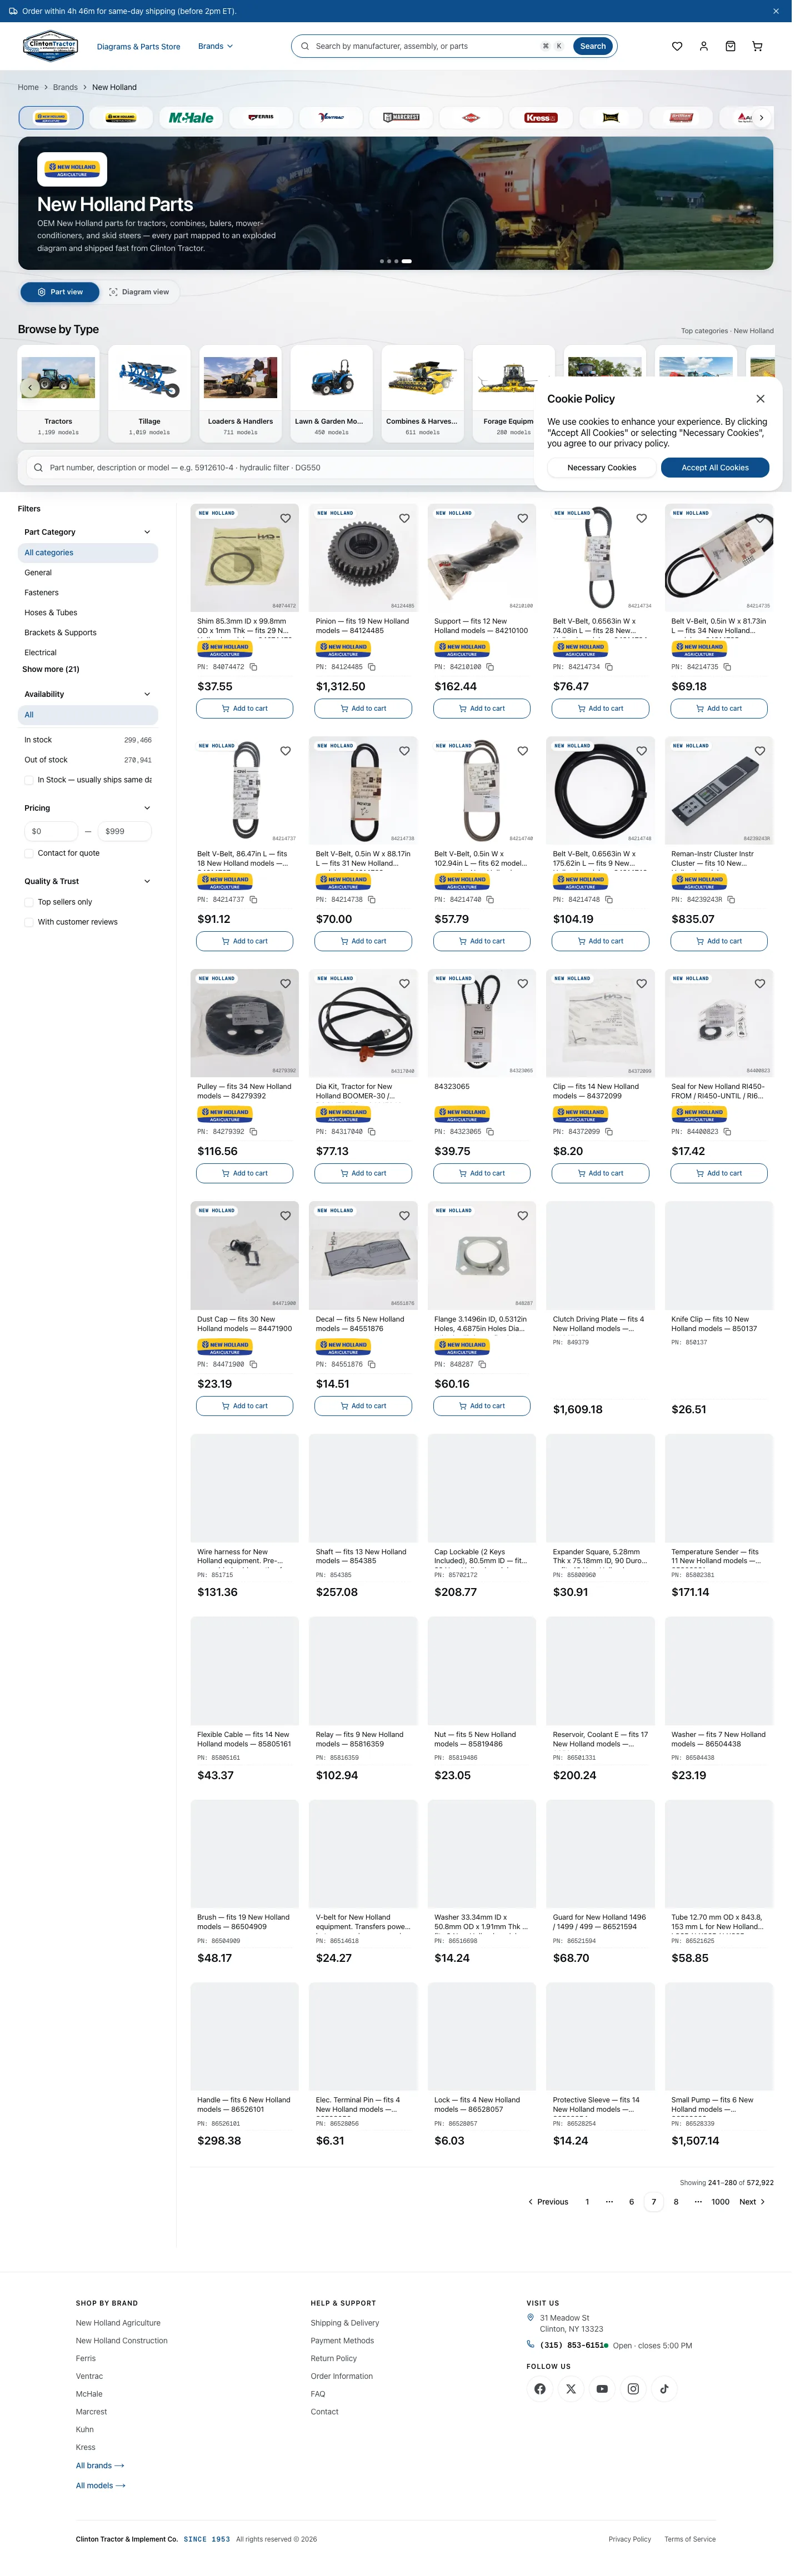
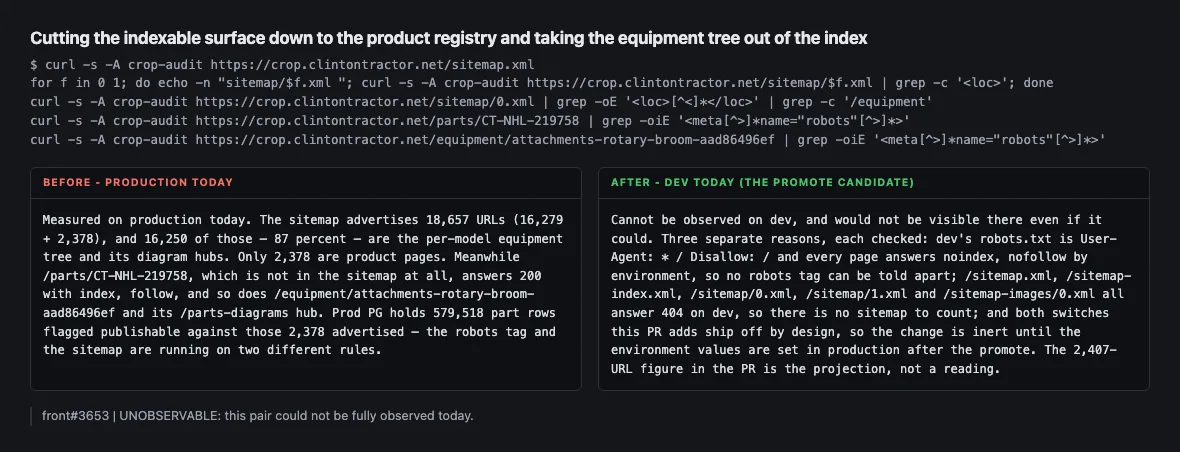
Cutting the indexable surface down to the product registry and taking the equipment tree out of the indexnot observablefront#3653
Before — production todayMeasured on production today. The sitemap advertises 18,657 URLs (16,279 + 2,378), and 16,250 of those — 87 percent — are the per-model equipment tree and its diagram hubs. Only 2,378 are product pages. Meanwhile /parts/CT-NHL-219758, which is not in the sitemap at all, answers 200 with index, follow, and so does /equipment/attachments-rotary-broom-aad86496ef and its /parts-diagrams hub. Prod PG holds 579,518 part rows flagged publishable against those 2,378 advertised — the robots tag and the sitemap are running on two different rules.
After — the candidate todayCannot be observed on dev, and would not be visible there even if it could. Three separate reasons, each checked: dev's robots.txt is User-Agent: * / Disallow: / and every page answers noindex, nofollow by environment, so no robots tag can be told apart; /sitemap.xml, /sitemap-index.xml, /sitemap/0.xml, /sitemap/1.xml and /sitemap-images/0.xml all answer 404 on dev, so there is no sitemap to count; and both switches this PR adds ship off by design, so the change is inert until the environment values are set in production after the promote. The 2,407-URL figure in the PR is the projection, not a reading.
This pair could not be observed today — the reason is in the two lines above, and no number has been invented to fill the gap.
A deep listing page telling Google to slow down crawling should answer come-back-later, not brokennot observablefront#3628
Before — production todayProduction answers 500 on both, with no Retry-After and no noindex header: /parts?page=500 in 17.0 s and /parts/brand/new-holland-agriculture?page=300 in 19.3 s. Repeated 500s are what tell Google to crawl the site less.
After — the candidate todayCannot be observed on dev. Dev answers 200 on both of those URLs — 11.6 s and 14.9 s — an empty listing with zero product links, because dev's search backend does not refuse the deep page the way production's does. The change only relabels a page that failed, and on dev nothing fails, so nothing relabels. Production search is also degraded today (CROP-search#924, the queued promote), which means I cannot separate a by-design refusal of a deep page from that outage even on the production side.
This pair could not be observed today — the reason is in the two lines above, and no number has been invented to fill the gap.
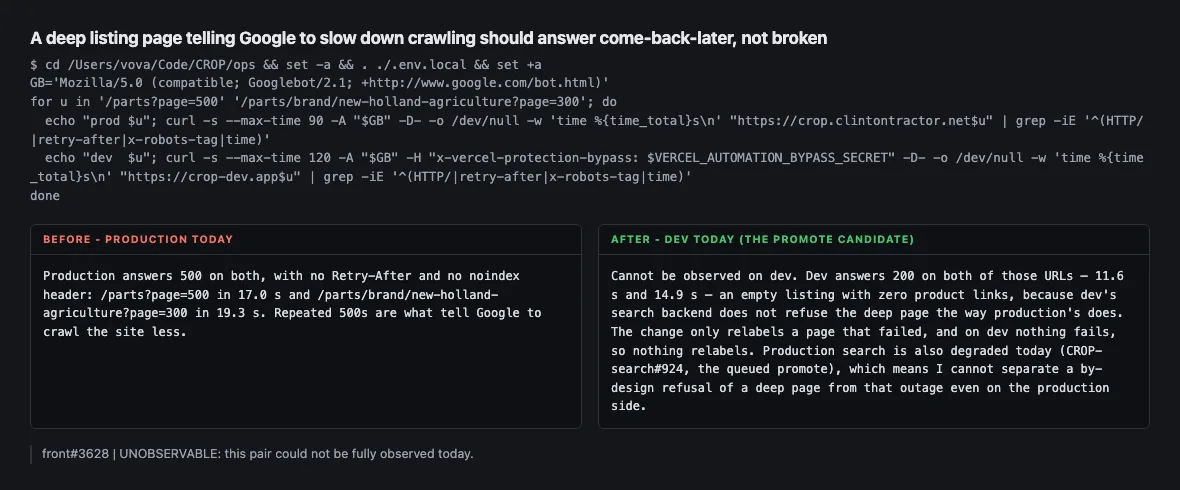
What this section does and does not proveAll eight PRs are merged into dev. The two newest (#3700 at 01:27Z and #3710 at 02:45Z today) are visibly live on dev, so the dev site carries all eight — that was checked, not assumed. The one thing that shapes this whole theme: dev tells Google to stay away entirely. Its robots.txt is "Disallow: /", every page carries noindex, nofollow, and there is no sitemap at any address. That is correct and deliberate — dev must never be indexed — but it means the robots tag itself is the one thing dev cannot demonstrate. Anything in this theme that is a robots tag reads identically on dev whether the change works or not. What dev CAN show, and what the six measured rows lean on, is: the HTTP status a URL answers, the response headers, the canonical and title tags, and the links a page emits. Those are environment-independent and every one of them was read off a live probe. That is why front#3653 — the largest change of the eight by URL count — is the one row with nothing in its after column. It is a robots tag and a sitemap, and dev has neither. Its before is fully measured on production though, and it is the number worth taking to the meeting: the sitemap advertises 18,657 URLs, 16,250 of them equipment tree pages, only 2,378 product pages — while 579,518 part rows in the production database are flagged publishable and pages outside the sitemap answer "index me" anyway. The two halves have never agreed. Two numbers here came from querying production PostgreSQL directly rather than from a PR description: 75,048 parts with no CNH data plus 332,254 withdrawn parts carrying neither a price nor an image, totalling the 407,302 URLs in row one, and the 13,626 that keep their page. Those independently reproduce what front#3700 claimed. gcloud is not authenticated in this session. No row needed it, so nothing is missing on that account. Production search is degraded today (CROP-search#924). It touches exactly one row — the deep-listing one — and I have said so there rather than quietly attributing a 500 to the change.
The Google product feed — 7 changes, 0 a customer or Google can notice
How many products the Google feed can carry, and how many files it splits intomeasuredsearch#904
Before — production today{"total":2681,"batchSize":5000,"boundaries":[]} — 2,681 products eligible for the feed, in one file. The binding gate was clinton_on_hand > 0, so only parts physically on Clinton's own shelf could be advertised.
After — the candidate today{"total":97619,"batchSize":25000,"boundaries":["NHL|47886103","NHL|84071622","NHL|87419908"]} — 97,619 products across 4 files of 25,000. 36x the population, and 4 Merchant Center data sources instead of 20.
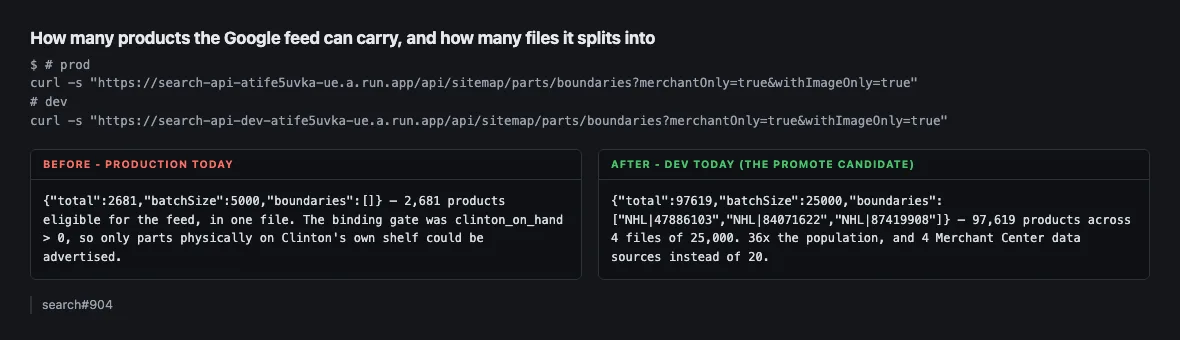
The product photo the feed points Google at actually loadsmeasuredsearch#904
Before — production todayProd emits the photo URL without the parts/ bucket prefix — https://media.clintontractor.net/ct/bns/1650347SM/gallery/1650347SM-1.jpg. 405 of the 2,681 prod rows have that shape, and 10 of 10 sampled return 404.
After — the candidate todayDev emits https://media.clintontractor.net/parts/ct/bns/1650347SM/gallery/1650347SM-1.jpg, and 10 of 10 sampled return 200. Same photo, same part: the prod URL 404s and the dev URL 200s side by side.
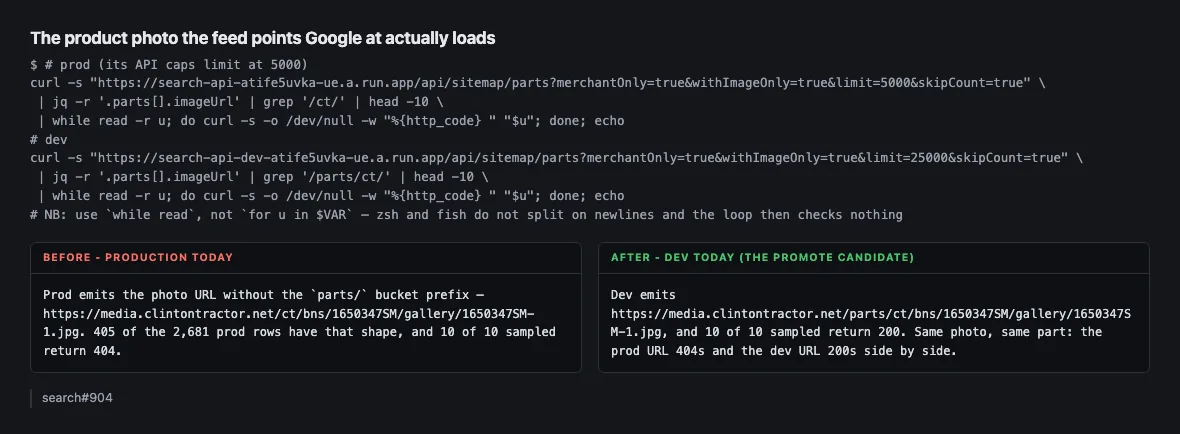
The feed's product photo is big enough for Google Shoppingpart-measuredfront#3655, search#904
Before — production todayThe live feed advertises the CNH catalogue thumbnail on 2,278 of 2,632 items (86%). 12 of 12 sampled measure exactly 510x287 — 0 of 12 clear Merchant Center's 500x500 floor, so those items would be size-rejected. The ops audit scored the same thing 4 of 24.
After — the candidate todayThe merchant rows the new feed reads carry the gallery photo instead: 12 of 12 sampled are >=500x500 (1024x1024 typical, one 1612x1209), and 25,000 of 25,000 rows carry a photo at all. Honest caveat: this is measured on the source the new feed reads, not on the feed file, because /feed/google/*.xml returns 404 outside production. The feed's own g:image_link can only be measured after Friday's promote.
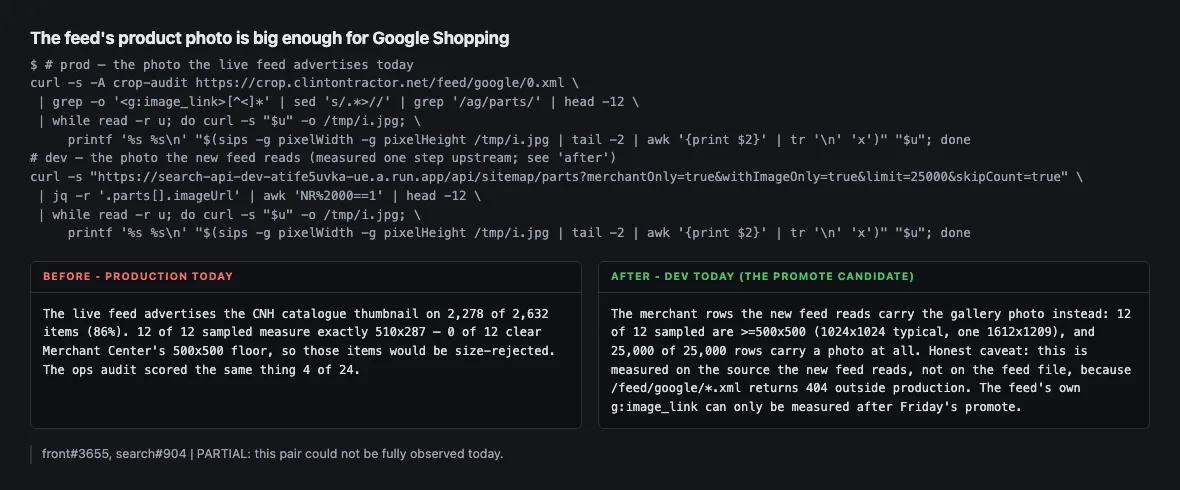
Item ids, product category and shipping inside the feed file itselfnot observablefront#3655, front#3690
Before — production todayMeasured on prod today: 1 shard, 2,632 items (shards 1-3 return 404). Audit criterion 1 FAILS — 0 of 2,632 g:id carry the canonical CT-VENDOR-PN SKU; they are bare part numbers like 1650347SM, so Merchant Center would key its product statistics to an id we are about to change. g:google_product_category is 888 (the bare Vehicles & Parts root) on all 2,632 items; g:product_type on 0 items; g:shipping on 2,256 (85%), a flat 9.00 USD that contradicts the free-over-$75 rule; g:description byte-identical to the title on 2,306 (87%). Criteria 2 and 4 pass today: links 40/40 return 200 with no redirect, parity 20/20 feed == PDP JSON-LD.
After — the candidate todayCOULD NOT BE MEASURED. /feed/google/0.xml through 3.xml all return 404 on crop-dev.app: the route fail-closes outside production on IS_INDEXING_ENABLED, by design, so a 404 there is correct behaviour and not a fault. The audit run against --base https://crop-dev.app reports 0 shards / 0 items for that reason, not because the feed is empty. The 404 is a genuine 404 and not the Vercel login wall — the same bypass header on /parts/CT-FER-1608395 returns 200 with the effective URL still crop-dev.app. The first observable after is this same audit command re-run against prod once Friday's promote lands.
This pair could not be observed today — the reason is in the two lines above, and no number has been invented to fill the gap.
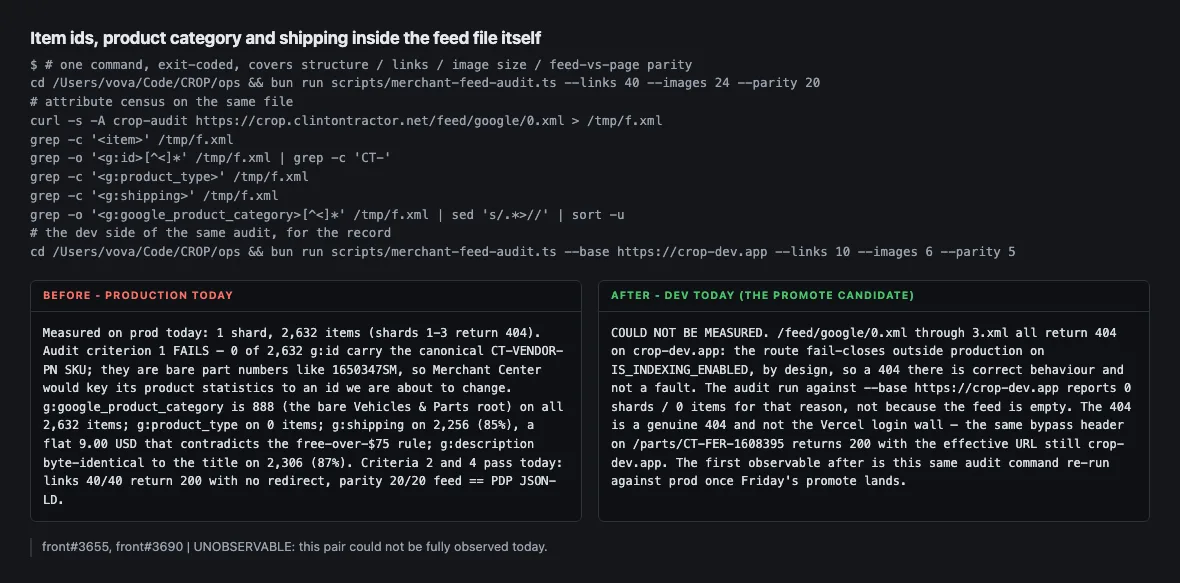
What a part page tells Google about stock, price and the product's namemeasuredfront#3645
Before — production todayProd. Across 12 sampled part pages, 9 state stock to Google and 3 omit availability from the Offer entirely — CT-AGC-000-1158, CT-AGC-000-1182, CT-FER-1608395. CT-AGC-000-1158 renders the badge "Out of Stock" in its own server HTML while telling Google nothing at all. On CT-FER-1608395: name = "Spring-Extn 1.040ODX 04.000LG .105WIRE D... 1608395" (a literal ellipsis from a 70-character clamp, with the part number appended); description = "Genuine Ferris spring-extn, part 1608395. $13.99 at Clinton Tractor." (the price sits inside the product description, so it goes stale); category = "Ferris", which is the brand, not a category; itemCondition sits on Product; seller is an anonymous Organization; no @id on either node.
After — the candidate todayDev. 12 of 12 sampled pages state availability. The three prod omitted read OutOfStock / OutOfStock / InStock, and on CT-AGC-000-1158 the JSON-LD and the server-rendered badge now say the same thing — both Out of Stock. On CT-FER-1608395: name = "Spring-Extn 1.040ODX 04.000LG .105WIRE D" (no ellipsis, no appended part number); description = "Genuine Ferris spring-extn, part 1608395." with the price gone; category absent rather than wrong; itemCondition moved onto the Offer; seller carries @id .../#org and the Product carries @id .../#product, so Google resolves one seller entity instead of an anonymous one.
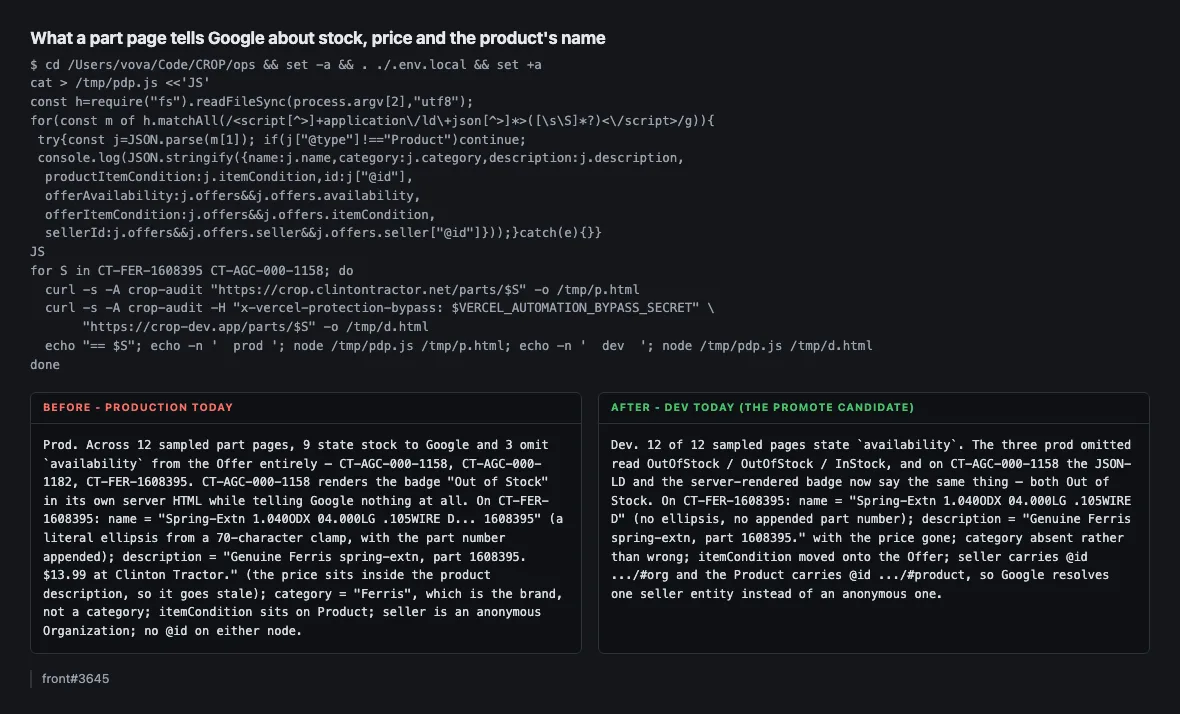
Every price the listing page shows Google is actually printed on the pagemeasuredfront#3629
Before — production todayprod {"numberOfItems":40,"entries":40,"priced":40,"pricesVisibleInHtml":18,"entriesWithImage":0} — Google is told 40 prices and can find only 18 of them anywhere in the page's own HTML (18 is exactly the eager-render budget; the other 22 cards ship a price-less placeholder). Not one of the 40 entries carries an image. Marked-up content that is not visible on the page is a Google structured-data policy violation, and it is enforced across a whole site at once, not per URL.
After — the candidate todaydev {"numberOfItems":40,"entries":40,"priced":40,"pricesVisibleInHtml":40,"entriesWithImage":40} — all 40 marked-up prices appear in the page's non-script HTML, and all 40 entries carry an image.
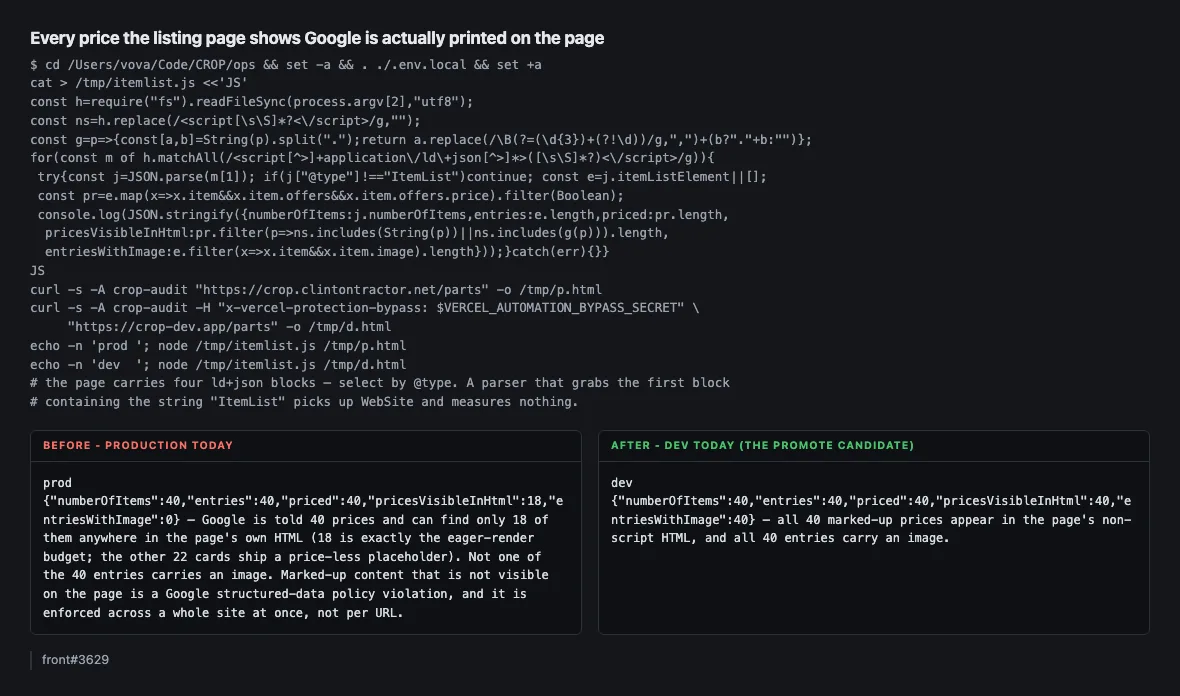
The parts-diagram page is sent once instead of twicemeasuredfront#3630
Before — production todayprod: 516,737 bytes, 64 /parts/ links for 16 distinct parts — every part's link sent four times, because the whole bill-of-materials subtree was rendered twice (once per breakpoint) and each row stacked a second copy of its part-number link.
After — the candidate todaydev: 360,590 bytes (-30.2%), 16 /parts/ links for the same 16 distinct parts. The unique link count is identical on both sides, so no link was lost — only the duplicates. The win scales with how many rows the diagram has; this is a 16-row page.
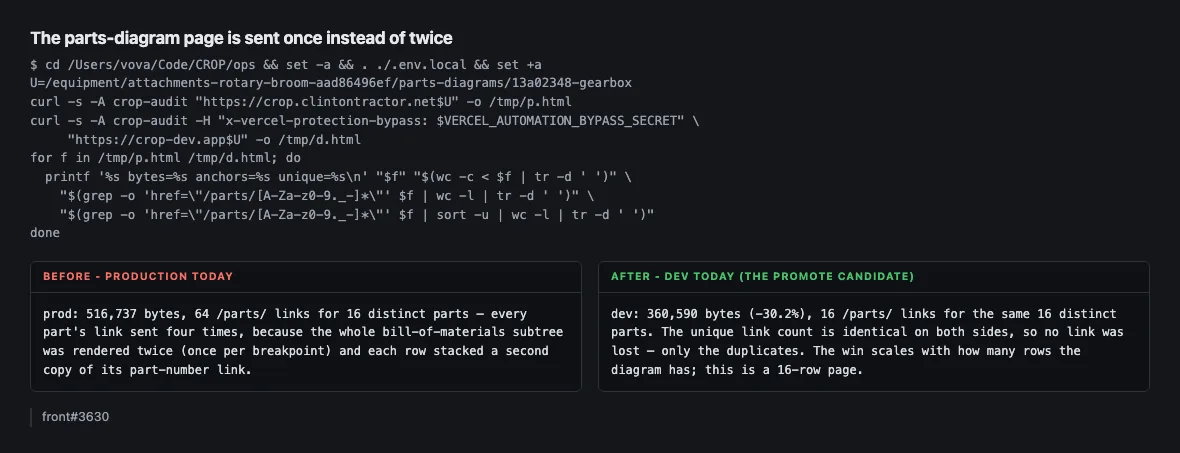
What this section does and does not proveCONTROL FOR THE KNOWN PROD SEARCH OUTAGE. It reproduces exactly, and it did not touch anything I measured. On a query string never used before: prod /parts?q=zqx7bromegear20260820 returned 500 after 16.8s, dev returned 200 after 8.1s. But none of the seven rows above go through the query path. The surfaces I actually measured were all healthy on prod at probe time: /parts (no query) 200 in 1.43s, /parts/CT-FER-1608395 200 in 1.15s, /feed/google/0.xml 200 in 0.35s. So no row above is confounded by CROP-search#924.
DEV AUTH WAS VERIFIED, NOT ASSUMED. Every dev probe sent the bypass header and I checked %{url_effective} came back as crop-dev.app rather than vercel.com. A dev PDP returns 200 under that header, which is what makes the feed's 404 on dev meaningful: it is the route fail-closing on IS_INDEXING_ENABLED, not the login wall. The secret value was never printed, logged, or written anywhere.
ROW 4 IS THE ONE THAT CANNOT BE MEASURED, AND IT IS THE HEADLINE CHANGE. The feed file itself only exists in production. That means the biggest item in this theme — 2,632 items becoming ~97,578, bare part numbers becoming canonical SKUs, a real product category, no more phantom $9 shipping — has a fully measured before and no observable after until the promote. I measured what I could one step upstream instead (rows 1-3, on the search API the new feed reads). Suggest the release page prints row 4's after in red as "could not be measured before the promote", with the re-run command attached, and that someone re-runs bun run scripts/merchant-feed-audit.ts against prod on Friday to close it. That single command scores all four acceptance criteria and exits non-zero on failure.
NOTHING IN THIS THEME IS VISIBLE ON THE SITE. Every row is machine-facing: what Google's crawler reads and what Merchant Center ingests. front#3629's own summary says "invisible to customers" and front#3630's says nothing changes on screen, which I did not independently re-verify in a browser. The payoff lands later, in how products appear in search results and Shopping, not in anything a customer sees tomorrow. That is worth saying plainly at the meeting so nobody expects a visible change.
ONE CLAIM FROM A PR THAT NO LONGER REPRODUCES. front#3629's before-table records that ?pageSize=80 announced 80 items over 50 entries. I probed it today and prod answers numberOfItems 50 over 50 entries, same as dev — the defect is not observable on prod any more, so I did not claim it as a delta. Two smaller notes in the same spirit: the prod boundaries endpoint reports 2,681 eligible while the prod feed file carries 2,632 items, the gap being rows the enrichment step cannot price or stock; and on dev's ?pageSize=80 listing 48 of 50 entries carry an image rather than 50, which is the documented rule that a row with no resolvable image drops its Product node rather than shipping a placeholder.
front#3690 merged this morning at 08:20Z and touches only the feed path (five empty-string and URL-encoding defects). Because that path 404s on dev, it sits entirely inside row 4's unobservable window — there is no probe that can separate it from front#3655 until the promote.
gcloud is not authenticated in this session, so nothing here rests on it. I did not need it: every number above came through the public HTTP surface, which is the same surface Google sees. One prod-side fact I did NOT verify and am not asserting: whether Merchant Center is currently fetching this feed at all. front#3655's setup doc implies the account configuration is meant to happen before the first fetch, which is why I marked all rows customer_visible=false — but that is an inference from the PR, not a measurement, and John or Vova should confirm it before anyone describes the current feed as live to customers.
Artifacts left behind for anyone re-checking: the prod feed capture at /tmp/prod-feed-0.xml (2,632 items), the prod and dev merchant row dumps at /tmp/prod-merch5k.json and /tmp/dev-merch.json, and the parsers at /tmp/pdp.js, /tmp/itemlist.js and /tmp/jsonld.mjs. These are scratch files, not committed anywhere.
Checkout, money and delivery — 7 changes, 4 a customer or Google can notice
A customer pasting a New Mexico address into checkout is no longer told we don't ship theremeasureda customer can see thisfront#3642
Before — production todayorigin/main (what production is built from) answers: REJECT: International addresses are not supported. We currently ship to US only. A US street named after a country fails the same way — '456 Mexico St, Springfield, IL 62701' is also rejected. Typing 'NM' works; pasting the full address does not.
After — the candidate todayorigin/dev answers: OK state=NM. '456 Mexico St, Springfield, IL 62701' -> OK state=IL. A genuine international address is still refused: 'Calle Reforma 100, Mexico City, DF 01000' -> REJECT: International addresses are not supported.
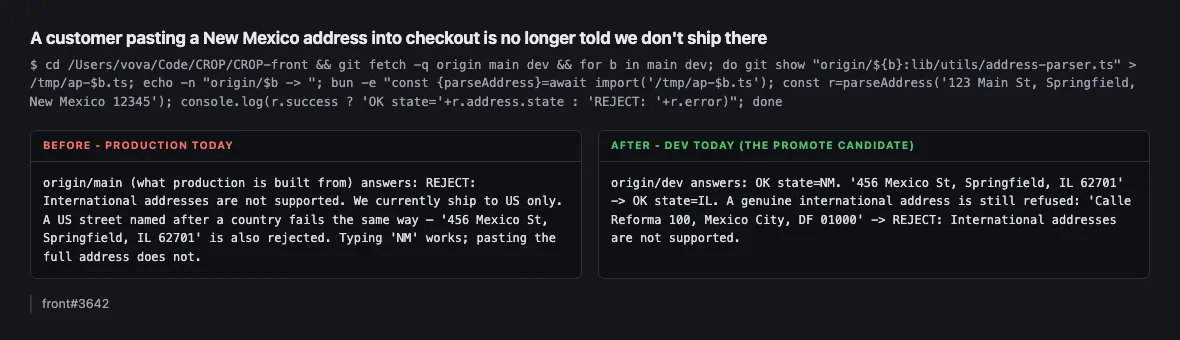
Proof the New Mexico fix is in the JavaScript the two sites actually serve, not only in the branchmeasuredfront#3642
Before — production todayProduction's shipped bundle: replace(/\s+/g," ");if(t=s,[/\b(?:canada|uk|united — the country test is the FIRST statement of the address parser, so it fires before any parsing runs and 'New Mexico' matches on the word 'mexico'.
After — the candidate todayDev's shipped bundle: ngs:s})}(t,i,a);return l?l:[/\b(?:canada|uk|united — the same country test now runs only after the parsing strategies returned nothing. Checked that the dev fetch stayed on crop-dev.app (url_effective=https://crop-dev.app/checkout/shipping, http=200), not a Vercel login page.
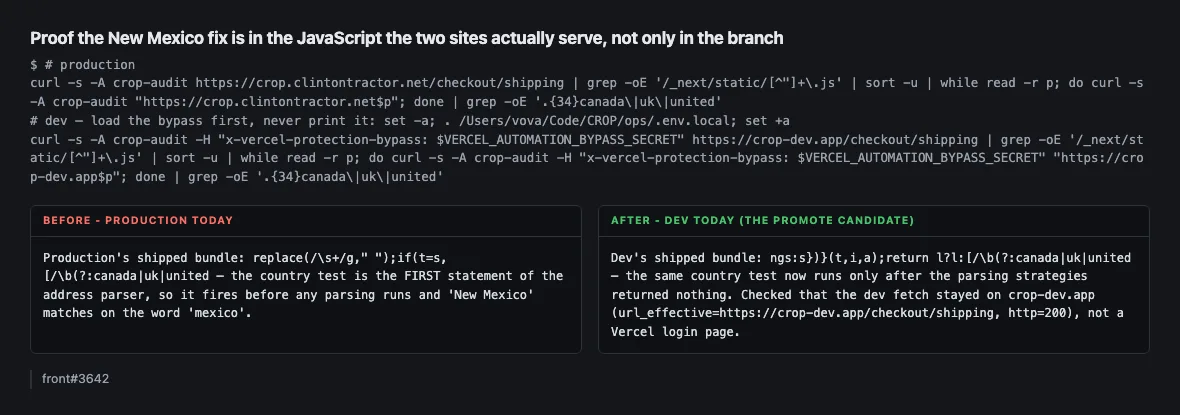
Express Checkout (Apple Pay / Google Pay / Link) re-checks prices against the catalogue before chargingpart-measureda customer can see thisps#615
Before — production todayorigin/main: 0 — the Express Checkout route makes no price check at all. The live payment-service was last deployed 2026-08-14 from main@be865716, so that is what production runs today: the browser's own unitPrice goes to Stripe unchecked, while the hosted checkout page refuses the identical cart.
After — the candidate todayorigin/dev: 2 references, the same guard the hosted page uses. The dev payment-service was deployed 2026-08-18 from dev@d626f353, which contains the fix (verified with git merge-base --is-ancestor). NOT probed at runtime on purpose: reproducing the before would mean writing a tampered cart and calling POST /payment-intent, which on production creates a real live-mode PaymentIntent. Deliberately not done.
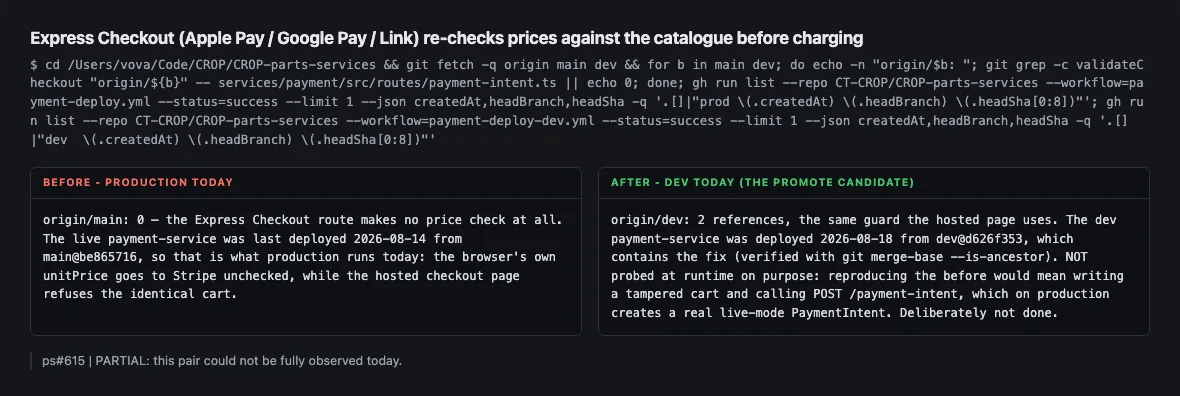
The money written onto a paid order (tax, shipping, discount, total, line prices) is now pinned by testspart-measuredps#613
Before — production todayorigin/main: 0. No test anywhere in the payment service reads what orderRepo.create is called with — every webhook suite asserted only that it was called. Tax, shipping, discount, total, currency and per-line unit prices could all be rewritten on every paid order with the build staying green.
After — the candidate todayorigin/dev: 1 suite, 7 cases, 17 literal expect( in the file (the PR reports 21 assertion calls when bun runs it), covering both order-writing paths — the hosted Checkout page and Express Checkout. I did not execute the suite in this pass; it needs a fresh worktree and a full bun install, so this row measures the code that is there, not a green run.
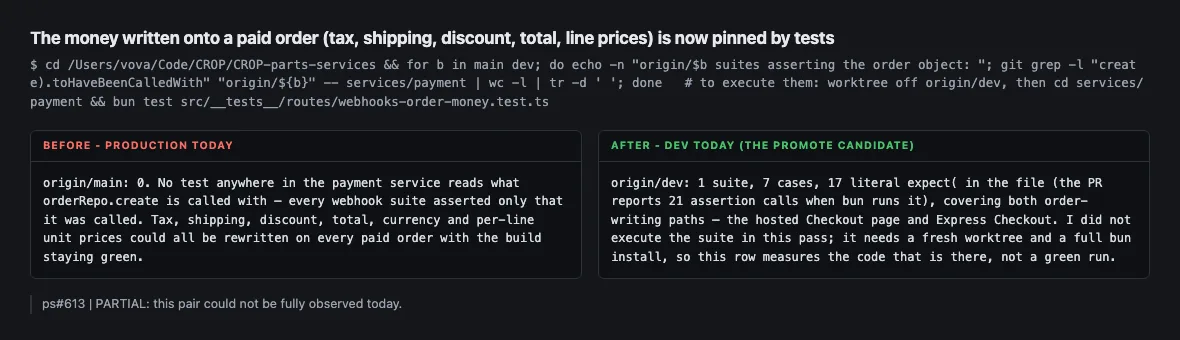
A UPS reply with no charge block is dropped instead of becoming a free shipping optionpart-measureda customer can see thisps#624
Before — production todayorigin/main line 188: cost: Number.parseFloat(total.MonetaryValue ?? '0') — an unpriced lane becomes exactly 0.00 and is offered to the customer as a real, selectable free option, with the carrier's actual bill left with us. Production's delivery-service was deployed 2026-08-14 from main@be865716, so this is live today.
After — the candidate todayorigin/dev line 178: Number.parseFloat(total.MonetaryValue ?? '') and a drop-with-warning when the value is not a finite number above zero; if every lane drops, the quote fails instead of going free. The dev delivery-service was deployed 2026-08-18 from dev@38352042, which IS the #624 merge commit. The symptom itself cannot be provoked from outside — only UPS decides when it answers without a charge block — so the before was not reproduced live, and 9 new tests (6 of them red before the fix) are what the guarantee rests on.
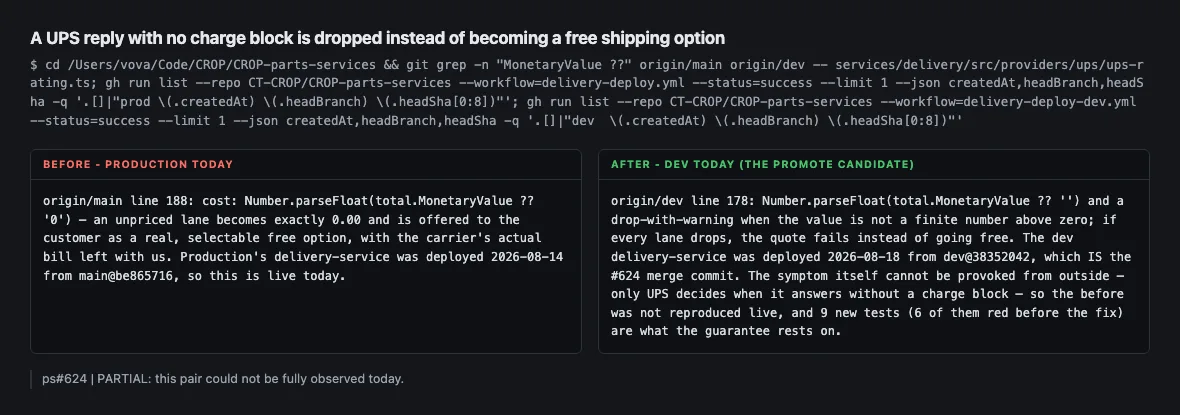
A real shipping quote to a New Mexico address still prices every lane the same on both sitesmeasureda customer can see thisps#624
Before — production todayProduction returns 5 options in 1.1s: Clinton Tractor In-Store Pickup $0, Clinton Tractor FREE shipping $0, UPS Ground $14.02, UPS 2nd Day Air $33.57, UPS Next Day Air $53.93.
After — the candidate todayDev returns the identical 5 options at identical prices in 1.5s. This is the guard against over-correction: our own two intentional $0.00 lanes (pickup and free shipping) survive untouched, because the new check lives inside the UPS provider only, and every UPS lane still comes back priced.
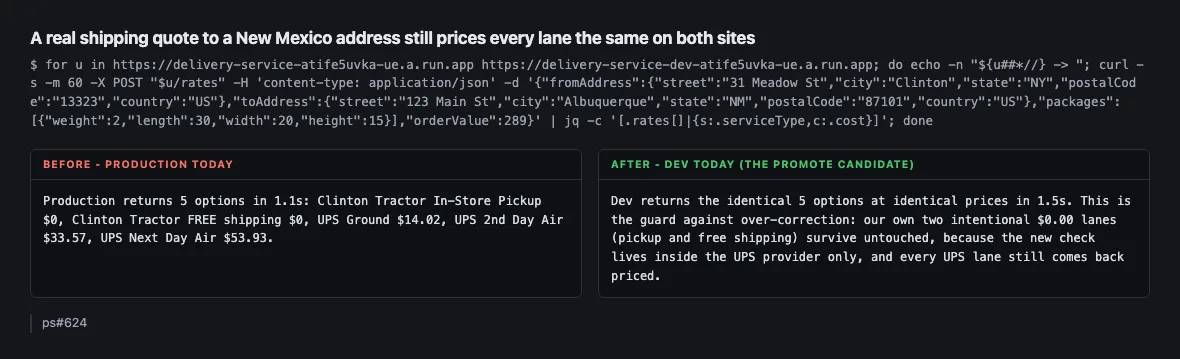
Which build each delivery service is actually running (and that the dev one cannot say)measuredps#624
Before — production todayProduction answers ready=true gitSha=be865716b8f668d3245e4595b82d3377cd1e5133 — it names its own build, and that commit is origin/main HEAD, dated 2026-08-14.
After — the candidate todayDev answers ready=true gitSha=unknown. The dev deploy workflow never passes the GIT_SHA build argument (only delivery-deploy.yml does, at line 103), so the dev service cannot identify itself and its build identity has to be taken from the GitHub Actions deploy record instead. Worth fixing: a promote-day check against dev cannot self-verify what it just tested.
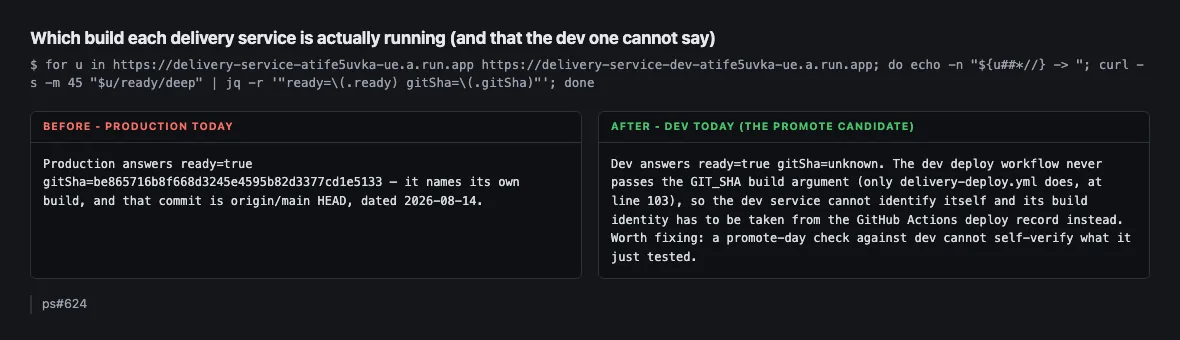
What this section does and does not proveAll four changes are dev-only today. Both production services in this theme (payment and delivery) were last deployed 2026-08-14 from main@be865716 — six days stale — and the production storefront bundle still carries the pre-fix address parser. Tomorrow's promote is what moves all four. Two of the four failure cases cannot be provoked from outside and I did not fake them. The Express Checkout price exploit (ps#615) would require creating a real live-mode PaymentIntent on production; the UPS $0.00 lane (ps#624) requires UPS to answer without a charge block, which we do not control. In both cases what I measured is which code each environment is running, confirmed by commit ancestry against the deployed image, plus the tests the PRs added. Three things the meeting should actually decide, not just note: 1. ps#615 changes behaviour for Express Checkout shoppers in a way customers will feel: a catalogue price that ROSE more than 5% after the cart was written is now refused with "Price mismatch". That is a stale cart, not tampering. The hosted checkout page has always behaved this way and Express now matches it — but today those shoppers sail through and pay the older, lower price. After Friday they are blocked and must reload the cart. Fixing it on one path only would recreate the asymmetry the PR closes, so it is one product call affecting both. 2. ps#624 fails closed: any cost of zero or less from UPS is treated as unusable, so a genuinely free UPS lane, if one ever existed, would be dropped rather than offered. The PR author flagged this as overrulable. 3. ps#613 pins a number nobody chose: a line total is stored unrounded, so 7 x $8.15 is recorded as 57.050000000000004. The new suite asserts that deliberately, to pin today's behaviour rather than hide it. No customer symptom — the charged total comes from Stripe, not from summing lines — but it is a real property of the order records and the author asked for it to be its own change. Method notes for anyone re-running these: gcloud is not authenticated in this session, so Cloud Run revisions and image digests are UNAVAILABLE — deployed identity came from the services' own /ready/deep and from the GitHub Actions deploy records instead. The production search degradation (search#924) did not touch any probe here: /checkout/shipping answered 200 on production, and the delivery service was called directly rather than through the storefront. The dev commands need the Vercel bypass header, loaded from ops/.env.local and never printed; the dev fetch was confirmed to end on crop-dev.app rather than a Vercel login page. One bash trap that cost me two runs: origin/$b:lib/... mangles the colon (it resolves to "origin/mainib/..."); write origin/${b}:lib/... instead.
Everything in this release — 96 changes, each with a one-line summary written onto the change itself
The store website62 changes 17 a customer or Google can notice
| Change | What it is | Before and after | Built by |
|---|---|---|---|
| front#3715 | The build fired one request per brand at once against a search service with twenty slots; the social-image step now reuses the sitemap's bounded helper, at most two in flight. | ~10 concurrent brand-taxonomy fetches -> at most 2 in flight; one shared helper replaces a private copy; does NOT fix the red build, which is external (CROP-search#874) | Vova |
| front#3712 | When the search backend is struggling, a part page showed a hard error; it now shows the same "temporarily unavailable, retry shortly" page the diagram pages already showed. | transient 429/5xx/timeout: hard 500 (probes 34.9s / 27.1s on /parts/CT-NHL-100016) -> ServiceUnavailable body, re-labelled 503 + Retry-After: 300 for crawlers | Vova |
| front#3711 | A test killed while typing kept typing into the next test, so unrelated tests failed on garbled input; the suite now fails and names the real culprit. | silent cross-test keystroke leak -> afterEach fails the test that left a userEvent loop running; 5 new guard tests, suite 1002 files / 10906 tests green | Vova |
| front#3710 | A withdrawn part's not-found answer was cached for up to a day, so a part restored overnight kept looking missing; that cache is now capped at five minutes. | edge 404 CDN TTL: s-maxage=3600 + stale-while-revalidate=86400 -> s-maxage=300 on both Vercel-CDN-Cache-Control and CDN-Cache-Control | Vova |
| front#3706 | Checkout address tests typed so slowly they overran the time limit and corrupted the next test, reddening unrelated changes; the typing delay is now dropped for that file. | 3-5 failures on unit-tests-shards (1) -> 9/9 passing, file time 2.28/2.09/2.08s -> 1.27/1.26/1.23s (~41% off) | Vova |
| front#3703 | Our own health check echoed whatever the search backend answered, so when search throttled, every test run declared the app dead; it now reports app and search separately. | /api/health proxied upstream 429/503 -> always 200 plus X-Upstream-Status; boot gate no longer fails while Next reports ready in 197ms | Vova |
| front#3701 | A timing check failed whenever the shared build machine was busy, blocking an unrelated change; it now takes the fastest of five runs instead of a single sample. | one sample (6.13ms on a busy shard, ~0.05ms idle) -> best of five against the same 5ms bound; a real scan still reds at 9.81ms | Vova |
| front#3700 | 407,302 part pages carrying no price, image or catalogue data still opened as real pages; they now return a proper not-found and no longer appear as links. | withdrawn cohort (all no_cnh_data plus price-less, image-less dont_list): 200, 286 KB, 11.2s -> edge 404, ~104 KB, under a second; 13,626 dont_list rows with content stay 200 | Vova |
| front#3695 | When the search backend is full it rejects requests; re-asking spent 10.7s of a 16.7s failed page load, so live traffic now fails at once and only builds retry. | runtime 429: 2 attempts / ~10.7s of a 16.7s failure -> 1 attempt, no retry; build-phase 429 retry kept | Vova |
| front#3694 | Two design-system checks printed four thousand findings and "PASSED" on every commit, so nobody read them; most findings were the checkers' own bugs, now fixed and shared in one module. | hardcoded-colour findings 3,779 -> 498 and 225 -> 66; the 3,281 removals are a strict subset, 0 new findings; no rule relaxed, no UI file touched | Vova |
| front#3692 | The dev search service was renamed away from its framework name, so a gate and two test fixtures still pointing at the old address were updated before it disappears. | search-nest -> search-api-dev in the brand-pdp-gate SEARCH_SERVICE_URL and two proxy test fixtures (3 lines) | Vova |
| front#3691 | Every storefront deploy to the dev site failed at the same step when the search backend briefly rate-limited it; the build now retries long enough to get through. | build-phase retry 2 attempts / 50ms -> 4 attempts / ~500-1500-4500ms; dev site was five merges stale, runtime path deliberately unchanged | Vova |
| front#3690 | Five ways an empty value or a "#" in a part number could drop or corrupt an item in the Google feed were fixed before the feed went live. | 5 defects red on origin/dev -> green here (5 failed | 1 passed -> 6 passed); offer-mapping.ts executable lines 309 -> 309 after the comment condensation | Vova |
| front#3689 | Two nightly jobs called tools their runners never had: one died in 90 seconds, the other could never send its alert; both now use what is actually installed. | e2e-stage gh api -> bun -e (the crop pool ships no gh); sitemap gate gains actions/checkout, ending its exit-127 escalation | Vova |
| front#3688 | Three nightly site gates blamed the site for being down when it was only the preview login wall; the message now names Vercel protection and the branch to check. | 302/401/403 read as target unreachable -> named as Vercel Deployment Protection, plus a guard pinning the bypass header on all three gates | Vova |
| front#3684 | During a search outage the garage told customers their saved parts were discontinued and offered one click to delete them; now only a genuine not-found means gone. | every fetch failure answered success: true with an empty list -> anything but a 404 reports failure and the existing "Could not load your saved parts" state renders; 3 of 7 cases red before the fix -> 7 passed | Denis |
| front#3678 | The nightly sitemap check timed out on a sleeping search backend and reported it as the catalog collapsing; it now retries and names an unreachable backend correctly. | --max-time 60 with no retry -> 120s with --retry 3 --retry-all-errors, against a measured 85s cold start; backend held 2736 parts throughout | Vova |
| front#3674 | Two quick jobs that build nothing were holding scarce Linux build machines, stalling whole pipelines behind them; they now run on the idle local Mac pool instead. | changes + seo-smoke on the crop Linux pool -> vars.CI_LIGHT_RUNNER; measured 7 idle Mac runners beside 11/11 busy Linux runners and 7 queued jobs | Vova |
| front#3671 | Two stage test lanes green-lit the Vercel login page as a live site, then waited 40 minutes on a build that had already failed; both now stop and say which. | dead-build bail-out 2400s -> 1s; preflight now sends the bypass header and rejects a vercel.com landing | Vova |
| front#3670 | Nothing is broken today, but the next automatic dependency refresh would have pulled in a database library that makes our four data-backfill scripts fail the moment they start. | bson unpinned (resolving 7.2.0) -> "bson": "7.2.0" in overrides; 2 lines, install unchanged at 922 installs across 985 packages | Vova |
| front#3669 | A parked test was labelled as failing its checks, sending one investigation after a bug that does not exist; the entry now records the real cause, a timeout. | reason "slug assertions fail (4 of 8 cases)" -> timed out on a 30s budget for 100 sequential live-prod fetches, on all 14 polled runs | Vova |
| front#3661 | Bundles the five fixes from the August crawl review into one gated batch: dead construction-part URLs, unencoded slashes, duplicate machine titles and diagram links that redirect. | 5 child PRs, 68 files, +2386/-823; CI 19/19 green, fallow audit 0 introduced | Vova |
| front#3660 | Different versions of one machine shared a single page title and heading, so nobody could tell them apart; most now carry the words that separate them, and none got worse. | duplicate titles 872 -> 526 (parts-diagrams) and 1,111 -> 620 (equipment), 0 regressed | Vova |
| front#3659 | Part numbers containing a slash pointed at a broken address in canonical tags, sitemaps and diagram links; the slash is now percent-encoded everywhere. | /parts/CT-BRL-1-1/2 -> /parts/CT-BRL-1-1%2F2 across five emitters; 2,545 publishable rows carry a slash | Vova |
| front#3658 | Diagram links on a part page used an old-style address that bounces through a redirect; all six link builders now use the direct one when the backend supplies it. | sampled PDP was 6 of 6 anchors in redirecting code form -> all six emitters prefer assemblies.slug | Vova |
| front#3657 | Construction-division parts dead-ended: the plain part-number URL redirected to an address that 404s. Those URLs now go to the working one the backend already names. | /parts/87438210: 308 -> CT-NHL- -> 404 becomes one 308 -> CT-NHC- -> 200; 11 live rows sampled, AG URLs unmoved | Vova |
| front#3656 | Our checklist for opening a brand to Google never asked whether that brand's URLs actually work; five runnable checks now gate it, and the flag table is rewritten to what a live prod probe shows. | checklist boxes 6 -> 11, flag table corrected against a live prod probe (2026-08-18) | Vova |
| front#3655 | Our Google Shopping feed listed only 2,635 parts because it required stock on our own shelf; it now offers 97,578 with correct ids, images and categories. | 2,635 items in 1 shard -> 97,578 in 4 shards of 25,000; hardcoded category 888 -> mapped (17 of 26 categories to a leaf); 510x287 thumbnails -> the >=500x500 gallery image; constant 9.00 USD shipping dropped | Vova |
| front#3653 | Our pages invited Google to index 352,201 products while the sitemap offered only 2,378; a switch cuts the invitation to the ~2,407 pages we have prepared, all still live. | behind two env flags, off on merge: 352,201 indexable PDPs + 8,126 equipment pages + 8,124 diagram hubs -> ~2,407 URLs, robots tag and sitemap on one registry rule | Vova |
| front#3652 | Storefront dependencies had drifted well behind their released versions; 34 are brought current inside their majors, with the framework and linter held back for their own reviews. | 52 of 85 declared deps behind latest -> 34 refreshed; unit suite unchanged at 992 files / 10693 tests, five email snapshots lose a preload hint | Vova |
| front#3645 | Part pages told Google a truncated name, the brand as the category and a price with no stock state; the markup and the breadcrumb now match the page. | Offer availability absent on 227,461 priced parts (44% of 512,404) -> always stated, floored to OutOfStock; Product.name mismatched the h1 on 47 of 52 sampled PDPs -> the h1 verbatim, no ellipsis | Vova |
| front#3643 | A brief search-backend hiccup used to kill the whole site build; the home page's popular-parts band and a part's assembly list now quietly go missing instead. | one transient /api/parts/popular timeout: next build exit 1 -> exit 0 with the band absent, degraded entry cached 5s not 24h | Vova |
| front#3642 | New Mexico addresses were rejected as international because "Mexico" matched inside the name; the country check now runs last, so a real US state and ZIP always wins. | 6 of 306 generated addresses rejected, all New Mexico -> 0; unreachable parsing strategy deleted; 16 tests -> 22 | Vova |
| front#3636 | Browser test jobs kept fighting the machine for a package lock and dying at start-up; the safe setting is now the default instead of a flag every job must remember. | 6 of 15 browser jobs inherited the apt-get default and raced the lock (exit 100) -> default flipped to "false", 9 redundant flags and their duplicated comments deleted (9 insertions, 43 deletions) | Vova |
| front#3630 | Assembly parts pages sent the same parts list four times in one download, bloating the page for crawlers and phones; it is now sent once. | assembly page 516,789 -> 362,021 bytes (-29.9%), non-script body 392,507 -> 240,899 (-38.6%), /parts/ anchors 64 -> 16 for the same 16 unique parts | Vova |
| front#3629 | Google was told 39 prices for one listing page while only 16 of them were on the page; now every advertised price is visible and every offered row has an image. | prices visible in the non-script HTML 16 -> 39 of 39 offers, entries carrying an image 0 -> 40 of 40, ?pageSize=80 announcing 80 items over 50 -> 50 over 50 | Vova |
| front#3628 | Deep listing pages the search backend declines were reported to Google as a server error; a crawler now gets a try-again-later 503 for any failed render on those routes instead. | /parts?page=184 through ?page=1000 (817 URLs) to a crawler: 500 -> 503 with Retry-After: 300 and X-Robots-Tag: noindex; the human path is untouched | Vova |
| front#3627 | An alert saying six brands are missing content in the live store was worded as a failed build, sending readers to hunt a broken pipeline; it now names the real finding. | twice-daily "CI gate FAILED: brand content gate on prod - 6 brand(s)" -> "Brand content missing: prod - 6 brand(s)", with the other four callers of the alert script byte-for-byte unchanged | Vova |
| front#3626 | Five uncovered files on the delivery and order path were pinned by new tests first, then 12 functions were shrunk until their 16 complexity excuses could be deleted outright. | 27 -> 11 complexity suppressions, none added; 5 new test files, unit suite 10,565 -> 10,684 tests; rendered DOM byte-identical to dev on both changed public routes | Vova |
| front#3625 | Five nightly test lanes had been red for days for causes nobody had checked; each cause was measured and fixed, so a red nightly means something again. | e2e-deep red 4 of 4 runs, e2e-mobile 3 of 3, sitemap gate 3 of 4 at 13% drift -> apt-lock race skipped (playwright-with-deps: false), 4 mobile specs quarantined, sitemap expected 2736 - 358 held = 2378 vs live 2378 (0% drift) | Vova |
| front#3621 | Dead brand and diagram URLs answered as if the page existed for browsers, and only Googlebot got a 404; now the edge returns a real 404 to everyone. | /brand/{slug} and /parts-diagrams/{brand}/{model}[/{assembly}] misses: browser 200 / bot 404 -> 404 for both UAs on 5 measured dead paths, 5 live controls unchanged | Vova |
| front#3618 | The breadcrumb audit was pointed at a URL that redirects away, so the equipment-variants template scored green without ever being fetched. Repointed at a model that actually renders it. | 1 false violation -> 0, template now genuinely covered | Vova |
| front#3616 | Eight functions across six files carried notes excusing how complex they were; they were split until the notes were unnecessary, no test file was changed, and the address parser was verified case-by-case. | 38 -> 27 complexity suppressions, none added; address-parser differential harness cases=201 mismatches=0; local Playwright now boots on the port baseURL names | Vova |
| front#3614 | Lint suppressions were hiding real defects, including a parts-list control no keyboard could reach; 25 are cleared by fixing the code, and false reasons on the rest are corrected. | 199 -> 174 suppressions (noExplicitAny 7 -> 0, noSvgWithoutTitle 5 -> 0); +210 characterization tests on the PDP view-model; the all-parts row control is now a real button | Vova |
| front#3613 not shipped | Closed unmerged - an admin page scoring 38 customer-facing promises against what the test runners actually collect, replacing a hand-kept ledger; dropped when its author left the team. | never merged; +3,454 lines across 16 files; measured 20 of 38 promises proven before merge, 12 overnight only, 1 all-skipped, 5 unclaimed; unit lines 72.50% | Denis |
| front#3610 | Every pull request was blocked by a link check that called slow pages broken; a page that times out now gets a longer retry before counting as dead. | 3 false dead links (all status: 0) on every PR -> a timed-out page backs off 3s and retries with triple the 15s budget | Vova |
| front#3608 | An internal metrics endpoint accepted unauthenticated writes to counters that were always zero; those handlers are deleted, and nine copies of one staff validation block became a single helper. | 89 audit findings -> 13 applied; net -140 lines across 19 files (-52 of them the metrics route), unauthenticated POST/DELETE on /api/internal/metrics removed, one complexity suppression dropped rather than reworded | Vova |
| front#3606 | Two test jobs on one machine shared port 3000, so one tested the other's build; each job now gets its own port and its server log is kept. | app-booting jobs that overlapped a sibling failed 20 of 41 (49%) vs 1 of 14 alone (7%) across 25 runs -> per-runner port, a dead server reds in one second, and an app-log artifact on every failure | Vova |
| front#3605 | Retired features left 24 modules nothing ran; 11 were invisible to the dead-code checker because each module's own test kept it looking alive, and deleting those surfaced the other 13. | 24 modules + 14 test files + 8 unread env vars deleted, +14/-6,086 lines across 42 files; dead:check empty -> still empty after the cascade | Vova |
| front#3602 | An earlier file move left a brand-name scan pointing at a deleted folder, so every build on the shared branch failed; the scan now points where those files actually live. | dev red with 4 blocking findings and six red jobs -> allowlist glob repointed from lib/parts-schematics/ to lib/brands/, same content, nothing newly silenced | Vova |
| front#3600 | A retired product left four live production web routes that nothing called, one fronting storage buckets and one holding a service key; all four are now deleted. | 4 dead API routes and 5 unused env vars removed, -756/+49 across 33 files; dead:check 1 finding -> empty report | Vova |
| front#3596 | Nothing stopped long comment blocks piling up in the code; now editing a file that carries a comment block over eight lines fails the build check. | no comment-length gate -> the lint job reds any changed file with a block over 8 lines; the 1331 legacy blocks in 892 of 2715 files stay green until touched | Vova |
| front#3592 | A filter that would empty the grid stayed clickable; the same-day and photo toggles now disable at a measured count of zero, while an unknown count leaves them enabled. | 6 of 45 category x brand pairs held parts but 0 same-day ones -> those toggles disable there; the review demo disables wherever another filter is narrowing the listing | Vova |
| front#3590 | Two competing category controls disagreed, and every category click dragged old sort and view params into a page we tell Google to drop; one control now mints a clean URL. | ?view=counter&pageSize=100&categoryId=FASTENERS (noindex, no canonical) -> ?categoryId=FASTENERS (index, self-canonical), net -919 lines | Vova |
| front#3586 | Brand listings offered Google all 1,000 pages, and 509 type pages claimed their parts lived on page one; deep pages are now hidden and each page points at itself. | brand + brand-type listings past page 5: index,follow -> noindex,follow; type-hub canonical bare path -> self-referential ?page=N (NH balers: 20,388 parts over 510 pages) | Vova |
| front#3577 | A display-only view setting made every page number a new URL Google could index; those variants are now marked do-not-index and dropped from the page-number links. | ?view= listings: index,follow + canonical to /parts -> noindex,follow with the cross-URL canonical dropped; pagination hrefs stop emitting ?view=counter&pageSize=100&page=1000 | Vova |
| front#3568 | Google's crawler was forced into a slow page build the cache never kept, capping how fast the site gets indexed; it now gets the same cached page shoppers get. | Googlebot: uncached BYPASS 0.87-4.52s -> CDN HIT with the same bytes a browser gets (browser HIT 0.20-1.40s); htmlLimitedBots override and its drift workflow deleted | Vova |
| front#3565 | A part with no price still showed a green In Stock chip and a same-day shipping promise above an "Ask for a price" button; now it reads Out of Stock. | 4 of 42 matrix cells failed on the old behaviour -> 42 passed; chip, ship line and CTA now derive from one resolution that takes sellability as a required input | Denis |
| front#3562 | The button that adds a whole diagram to the cart had no test proving it skips parts we cannot ship; five cases now lock that behaviour. | no test on the CTA's own composition -> 5 cases, 20 passed / 0 failed (2 go red with snapshotToDisplayState deliberately broken) | Denis |
| front#3483 not shipped | Closed unmerged - a test lane measuring whether parts imported from a vendor are findable by a shopper, parked red awaiting the vendor list, then dropped when its author left. | never merged; +246 lines in 3 new files; fixture committed empty so the suite fails by design; classifier matched the hand measurement on 3 vendors | Denis |
| front#3350 not shipped | Closed unmerged - a draft of admin photo-collector improvements, including sourcing images for New Holland Construction models the tool could not see; dropped when its author left the team. | never merged; 8 commits, 79 files on a stale fork point (body states the genuine delta vs dev is 29 files); branch tip recorded for reopening | Denis |
| front#3244 | The sitemap and the page itself decided indexability by two different rules; the stricter rule that makes them agree is now the default in code instead of a dashboard setting. | PDP_INDEXING_MODE default legacy -> strict, both surfaces on one registry predicate; side effect flagged: the unconditional adapter-brand hold (Ferris, McHale) goes dead, so those PDPs index when the registry says so | Vova |
The search service21 changes 7 a customer or Google can notice
| Change | What it is | Before and after | Built by |
|---|---|---|---|
| search#925 | Diagram lists for the busiest machines checked 62,153 records to fill one 50-row page; the query now starts from the model, and tied rows stop shuffling between pages. | busiest model: 377.6ms -> 35.5ms, count twin 23.2ms -> 0.6ms, buffers 355,529 -> 16,691; 14/14 md5-identical outputs | Vova |
| search#923 | The warm-up loop gave up after 25 seconds while a cold catalogue browse takes 33, so the gate still judged that page cold; attempts are now fewer but longer. | warm loop 6 x 25s, never finishing a 32.92s browse and burning 175s per URL -> 3 x 45s, 145s worst case | Vova |
| search#922 | Opening a Kuhn machine's parts diagrams counted every one of 15.5 million part rows just to show a few hundred numbers; it now counts only the diagrams shown. | model 2273: 16,132ms -> 109ms (-99.3%), buffers 3,140,327 -> 8,908 (-99.7%); output md5-identical on four models | Vova |
| search#920 | The three busiest catalogue endpoints, about three quarters of all traffic, queried the database on every single request and pinned it at full CPU; they are now cached. | chapters / model assemblies / assembly detail: 761 of ~1000 requests/hour (~76%) hitting PG raw -> served from the result cache; /api/assembly-search left uncached | Vova |
| search#918 | The deploy gate warmed cheap endpoints while judging expensive ones cold, so it failed on different tests each run; the four expensive shapes the suite actually asserts are now warmed too. | 4 asserted shapes unwarmed (7.15s -> 0.43s, 7.73s -> 0.40s, 6.26s -> 1.30s, 2.36s -> 0.42s on the second call) -> added to the warm list, ~15s more per run | Vova |
| search#917 | The last copy-paste example in the repo still pointed at the old dev search host, which stops resolving once that service is deleted; it now names the new one. | one usage line, search-nest-... -> search-api-dev-...; the two remaining mentions kept on purpose as image lineage and as history | Vova |
| search#916 | The dev search service was named after the framework it happens to use, which churns; it and its deploy workflow are renamed to describe the role instead. | service search-nest -> search-api-dev, workflow deploy-nest.yml -> deploy-search-api-dev.yml, image search-nest -> crop-search; prod search-api untouched | Vova |
| search#914 | A check script called the catalogue filter broken when it was fine, and a Kuhn test used 150,000 as both floor and ceiling; both now compare live numbers. | script failed at 1,140,643 rows against a 200K-400K band and pointed at a service deleted in #839 -> live-vs-live, NHL publishable 572,922 < unfiltered 975,998, exit 0 | Vova |
| search#913 | The filter sidebar had no time limit, so a busy database made it hang fifteen seconds and then error or quietly show no results; it now fails fast instead. | all nine /api/filters legs capped at 8000ms: ~15s (measured 15,082 / 16,114 / 14,360ms) 500 or silent total: 0 -> 503 + Retry-After | Vova |
| search#910 | One of the two checks failing the deploy gate was a hardcoded catalogue-size limit that had fallen behind real growth; it now compares two live counts, so it cannot expire again — the gate's other cause lands separately. | fixed ceiling 1,000,000 vs 1,140,643 publishable rows -> live baseline 1,567,259 via a count-only catalogTotal=true; rows served identical 20/20 | Vova |
| search#909 | Nothing executed the database rule deciding whether a part is in stock, so the stock filter and the stock badge could silently disagree; both now run over one 26-row matrix. | availability CASE asserted only toBeDefined() -> the real CASE and filter executed on a Postgres service container in CI; two seeded mutations caught 3 and 4 failures | Denis |
| search#906 | The search half of the crawl-fix train, carrying one change: the diagram list now returns each diagram's own web address next to the model's. | 1 child PR, 5 files, +90/-0; lint, typecheck, 2,736 tests and 176 offline tests green | Vova |
| search#905 | The parts-to-diagram list never returned each diagram's own web address, so the site could only link the old form that redirects; it now returns it. | /api/parts/{pn}/assemblies gains assemblySlug, null for brand catalogs; prod PG has 465,099 of 465,099 assemblies with a slug | Vova |
| search#904 | The parts feed could only offer items sitting on our own shelf, so it covered 2,684 parts; it now covers 97,578 sellable, pictured, priced ones. | source indexable_parts_v1 + merchant_eligible -> part_indexing_candidates_v1 + image/offer/commerce gates, 2,684 -> 97,578 rows; shard width 5,000 -> 25,000 (20 -> 4 Merchant Center data sources); ct/ image URLs 404 -> 200 | Vova |
| search#902 | Routine refresh of the search service's non-major dependencies, including the code formatter, whose new rule flagged test assertions that would have thrown instead of failing cleanly. | biome 2.5.2 -> 2.5.8 (schema realigned), Anthropic SDK 0.106 -> 0.117.1, yaml 2.8.1 -> 2.9.0, postgres 3.4.8 -> 3.4.9; 2734 unit + 176 offline tests green | Vova |
| search#900 | Nothing wrote down why every optional query needs a time budget, so the same fifteen-second stall could be reintroduced; the service guide now records the rules and traps. | undocumented -> 34 lines in CLAUDE.md: query budgets, three fail-open traps, and how to probe the deploy candidate before promoting | Vova |
| search#897 | Behind that cap the broken brand query still re-ran on every request, wasting database capacity; failures are now remembered for five minutes instead of retried forever. | failing brand snapshot re-run ~240 times/hour -> 12; q=ford 15,330ms -> 5,050ms on the deploy gate; stale browse ceiling 700K -> 1,000,000 | Vova |
| search#896 | Searches for anything the cache had not seen sat waiting up to fifteen seconds on a broken brand lookup; that lookup now gives up after 1.5 seconds. | cold /api/search total 15,661ms (wall 17.36s) -> federated brand fan-out capped at 1500ms, and the leg finally has its own Server-Timing segment | Vova |
| search#894 | After the framework cutover the search codebase kept duplicate homes for config, database, logging and telemetry, and two of four boundary rules guarded folders that never existed; both fixed. | lint:arch 2 of 4 rules dead -> 6 of 6 probed live by seeded violations; bun test src 2704 pass / 0 fail before and after | Vova |
| search#892 | The ships-same-day and photo filters had no count, so nothing knew they would return nothing; the filters API now measures both, letting the storefront switch a dead-end filter off. | no toggle counts -> toggleCounts on /api/filters browse mode in one extra scan, null (not 0) when it fails; 6 of 45 probed category x brand pairs have 0 same-day parts | Vova |
| search#891 | A parts diagram could badge a part In Stock while its own catalogue page called it out of stock; both now read the same depot signal through one shared rule. | BOM rows resolved on the retired orderability axis alone -> the catalogue tile's own resolveRowAvailability; parity check 8 of 19 cases failed before -> 19 pass | Denis |
The order and payment services8 changes 2 a customer or Google can notice
| Change | What it is | Before and after | Built by |
|---|---|---|---|
| ps#624 | A UPS reply with no price became a free shipping option a customer could pick, with the real carrier bill on us; such lanes are now dropped instead of quoted. | unpriced lane quoted at $0.00 -> dropped and logged, quote fails if all drop; parseRates had 0 tests -> 9 (6 red before the fix) | Denis |
| ps#622 | Five near-identical test jobs each paid a one-minute billing floor to run a few seconds of tests; they are now a single job with identical coverage. | 5 jobs, 75s real work / 300s billed -> 1 job, same 24 test files; roughly 420 ubuntu-minutes a month | Vova |
| ps#621 | Routine update of third-party code across all services, plus one deliberate lock that keeps out a database library version Bun cannot run. | 13 packages bumped in-major, biome 2.3.15 -> 2.5.8; bson floating -> pinned 7.0.0 (7.3.2 gave 10 delivery test failures, documents suite did not start) | Vova |
| ps#620 | Four backend services leak memory on a clock rather than on traffic — one leaked 2.87 MiB/h while serving zero requests — and it was being OOM-killed twice a week; the runtime moves to the Bun release that fixes the underlying TLS leak. | Bun 1.3.9 -> 1.3.14 across 25 files; leak baseline 2.87-4.43 MiB/h, the dev soak is the pass check | Vova |
| ps#619 | The repository guide now records the test-mocking trap that kept the build red for a day, so the next person does not rediscover it the same expensive way. | testing section: 3 bullets with no mocking guidance -> +16 lines covering both failure modes, the fix shape, and the skipped-vs-failed count gap | Vova |
| ps#618 | One test file's stubs leaked into every other file, hiding 16 tests and holding the merge gate red for a day; the stubs are now complete and restored afterwards. | Test - documents red on dev, 41 tests across 7 files -> 58 across 7 files, all green | Vova |
| ps#615 | Express Checkout took the price from the browser, so a tampered cart could buy a $289 part for a cent; prices are now re-checked against the catalogue first. | validateCheckout calls in payment-intent.ts: 0 -> 1, the same guard the hosted page uses; new suite 6 pass / 4 fail -> 10 pass / 0 fail | Denis |
| ps#613 | Nothing checked the money written onto a paid order, so tax, shipping, discount or total could change unnoticed; a new test pins the exact figures on both payment paths. | zero assertions on the order object (create).toHaveBeenCalledWith appeared nowhere in the payment service) -> 7 cases, 17 expect() calls, both order-writing paths | Denis |
The internal control room for parts data5 changes 0 a customer or Google can notice
| Change | What it is | Before and after | Built by |
|---|---|---|---|
| crm#22 | A vendor feed answering confidently with wrong data would have passed every check; twenty known-answer parts across four feeds are now re-checked on every health evaluation. | distribution checks only -> 20 seeded golden parts (5 each for Briggs, Kuhn, Ventrac, CNH) folded into the plausible gate; a never-read golden part counts as a violation | Alex |
| crm#21 | Dashboard tiles now carry a day-on-day trend, freshness is judged per brand rather than on a fixed 48 hours, and a missed nightly rollup now raises an alert. | one 48h freshness window for every brand -> each brand's own freshness_threshold_hours; tiles gain delta + 30-day sparkline; rollup-missing check on a */30 9-12 UTC beat | Alex |
| crm#20 | A silence audit closed three blind spots: seven jobs whose no-show alerted nobody, change counts that measured volume not news, and brand pages that never showed a data-updated time. | 7 lanes with no non-start expectation -> watched; eparts reports a real BOM/hotspot diff instead of rows rewritten; the three peripheral feeds stamp source_max_checked_at | Alex |
| crm#19 | Kuhn, Ferris and Ventrac feeds reported zero changes every night while their stock moved, so the dashboards showed a false calm and healthy brands were heading for false alarms. | changes_found stuck at 0 on all three feeds -> real state transitions counted (KUH 512, FER 24, VNT 59 in 14 days had been reported as none) | Alex |
| crm#18 | Nobody could see how the parts data was doing without running queries; there are now dashboards showing catalogue size, freshness and daily changes per brand. | checking catalogue health meant running queries by hand -> /dash/ pages served from a nightly 07:30 UTC DailyBrandMetric rollup, 69 new tests | Alex |
What was live before, and what is live now — the exact thing to go back to
The left of each pair was read off the running systems on Thursday 20 August, before the release. The right was read off the same systems on Saturday 22 August, after it. Going back means going back to the left, and the row that was missing on Thursday — the search rollback name — is filled in below.
| Storefront | 0ee970f4b → 137e97ed2 | Live since Friday afternoon. Vercel keeps the previous build, so going back is one button. |
|---|---|---|
| Search | search-nest:2da1a51e → crop-search:678b7af2 | Swapped overnight before the release, ahead of the storefront. Thirty-two changes moved in that one step. The old image lives under a registry path that was renamed mid-week, so the address to go back to is not the one a new build writes to — it is written out in full here, which is now the only place it is recorded. |
| Services | be865716b → d35bec865 | Order and payment services. The service changes that had been waiting — four of them since 11 August — went out together. |
| Search rollback name | search-api-00019-kxl | This is the row that said
“not read” on Thursday, when the cloud login had expired and no name was guessed rather than
invented. Read directly today: search now serves everything from search-api-00042-fim, and
the one above it is what that replaced. One thing to know before using it: search now gives itself up to
twenty machines where on Thursday it was held at two, and putting the old image back does not put that
back. |
| Database | unchanged | No migration in this week's storefront or search work, and none was run with the release. The parts-data backfill that did write to the live database was run days beforehand and was already in place. |